Sinking Land Brings Calls for Pumping Alternative

 by Neena Satija

Amid a persistent drought, a growing population and a dwindling supply of surface water, much of Texas is searching for underground water resources.

But a large swath of Texas — home to close to one-quarter of its population — is looking for water supplies anywhere but beneath its surface. A century of intense groundwater pumping in the fast-growing Houston metropolitan area has collapsed the layers of the Gulf Coast Aquifer, causing the land above to sink. The only solution is to stop pumping, a strategy that some areas are resisting.

The geological phenomenon, unique to this part of Texas because of the makeup of the aquifer’s clay layers, is known as subsidence. Areas in and around Houston have sunk as much as 10 feet in 100 years, causing neighborhoods to flood, cracking pavements and even moving geologic faults that could lead to infrastructure damage. “It’s an upfront and personal issue when you’re on the coast and you see land loss,” said Mike Turco, who heads the subsidence districts responsible for addressing the problem in Harris, Galveston and Fort Bend Counties. “You have oil barracks that are out in Galveston Bay now.”

Subsidence has long been a concern in Harris and Galveston Counties, which are nearer to the gulf and more prone to flooding. Spurred by state lawmakers in the 1970s, the counties have worked to reduce their groundwater dependency to 25 percent from more than 50 percent. That number will continue to fall as they increase their reliance on rivers like the Trinity and San Jacinto, as well as planned reservoirs.

Neighboring Fort Bend County, on the other hand, which still relies on the Gulf Coast Aquifer for 60 percent of its water, is farther inland, and the effects of subsidence can be less tangible.

“There are perception issues,” Mr. Turco said. Whether subsidence means anything to someone depends on where you’re standing, he said. “If you’re standing next to the river, it could be a big deal.”

In Fort Bend County, unlike Houston, “there isn’t a ship channel to walk to,” he said.

Now that the county is starting to grow, in part because of the expansion of nearby Houston, studies by the subsidence districts estimate that if nothing is done, parts of Fort Bend County will sink about five feet in the next four decades. The impact could be lessened to just two feet under recent regulations asking certain areas to convert 60 percent of their groundwater supplies by 2025. Not everyone agrees with the approach. Some towns dislike the rules that force them to find alternative water supplies, worried about the high cost of conversion and unsure whether their own land is actually sinking.

“Typically, subsidence is equated to growth,” said Terri Vela, the city manager for Richmond, which is about 30 miles west of Houston. “And Richmond proper has not seen that growth. I don’t even know that we have subsidence today in Richmond.”

Ms. Vela pointed out that subsidence in the county affected some areas more than others. For instance, the land has sunk nearly a foot in 15 years just a few miles to the east of Richmond, in booming Sugar Land. But in Richmond itself, the ground has lowered less than three inches — although the Fort Bend subsidence district warns that could change if its outlying areas continue to grow as they have in recent years.

Alternative supplies have been difficult to find, Ms. Vela said. About five years ago, Richmond and a neighboring town, Rosenberg, secured a long-term contract to take water from the Brazos River, with plans to build a water treatment plant. But then the area was hit by drought, and the river’s flows were at their lowest by 2009. the towns were then besieged with requests from industrial and other water users to buy the newly acquired water.

The overwhelming demand for Brazos River water led the towns to question whether it would really be available. “Is this a long-term, sustainable water source?” Ms. Vela said. “Everyone else has put their straws in before we’ve gotten to it.”

Recently a company called Electro Purification approached the towns with a different solution: The company would drill wells on the other side of the Fort Bend County line. In other words, they would continue pumping groundwater from the same clay-based aquifer but outside the jurisdiction of the subsidence districts.

The proposal drew public outrage, with residents submitting hundreds of public comments questioning its effect on water levels in the aquifer and on subsidence.

According to studies by the Fort Bend district, the wells could cause the ground to sink an additional two feet in some parts of the county and potentially cause sinking in nearby counties. But those numbers have been disputed.

“There is more data out there that hasn’t been evaluated,” said Mike Gershon, an Austin-based lawyer for Electro Purification. “At this point, no one has told us what they think subsidence is realistically going to be on their property and what that adverse impact is going to be.”

Mr. Gershon said the company was willing to change its proposal based on subsidence concerns. “We want to make sure that our scientists, and we think we have good scientists — that they’re getting it right,” he said.

The case has been referred to an administrative law judge, who will hear arguments next year on whether the wells should be allowed. In the meantime, the Fort Bend Subsidence District is weighing its options. While it cannot prevent the drilling of wells outside its borders, the district could refuse to accept Richmond and Rosenberg’s plan for finding alternative water supplies.

“Here we have a proposal to convert to something that’s not really an alternative water supply,” a lawyer who represents the district, Greg Ellis, said. “It’s the same aquifer. It’s just 15 miles west.”

While some areas of Fort Bend County are sure to see more subsidence than others, based on population density, everyone must pitch in to reduce the problem, Mr. Ellis said.

“I think it’s the standard — my car doesn’t cause all the traffic; it’s all the other cars that are causing the problem,” he said, characterizing the attitude of Richmond and Rosenberg. “And my car was here first. So all you other people should take care of the problem.”


Source: New York Times.

Pure Water Gazette Fair Use Statement

The Dead Sea:

Environmentalists Question Pipeline Rescue Plan

By Julia Amalia Heyer and Samiha Shafy

An “historic” agreement between Israel, Jordan and the Palestinians is supposed to save the shrinking Dead Sea. But some environmentalists believe the plan to pump water from the Red Sea could do the salt lake more harm than good.

Even as it shrinks in size, the Dead Sea, a turquoise blue shimmering salt lake, remains a mystical place. Boat jetties jut out into nothingness, abandoned as the water has retreated further and further; each year the level dropping by a meter. The Dead Sea is dwindling to nothing, deprived of water by humans.

Where there once was water, there is now a crumbling coastline, which is already riddled with deep craters that can open up suddenly. Nonetheless, the lake’s withered beauty still attracts many to its shores.

The only question is, for how long?

The Dead Sea is now set to be saved — but the plans of its self-appointed savior may actually turn out to be more like euthanasia.

Last week, Israeli Energy Minister Silvan Shalom, together with his Jordanian and Palestinian counterparts, agreed to a joint project which, it was solemnly declared, would prevent the Dead Sea from drying out. At the same time, what Shalom described as an “historic agreement” would secure water supplies for the notoriously arid region — and send a signal of international understanding in the Middle East.

The Dead Sea’s water level is dropping at an alarming rate.

Nothing But a Waste

But numerous environmentalists and the 20 Palestinian NGOs who spoke out in advance against the project argue that the acclaimed agreement is nothing but a waste.

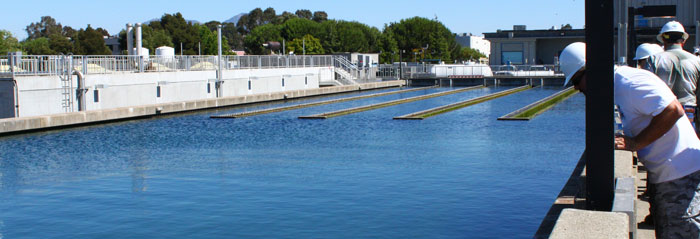
The plan is to build a desalination plant in the Jordanian city of Aqaba on the Red Sea, which will then supply both the neighboring Israeli city of Eilat and southern Jordan with fresh water. The brine that is created in the desalination process will be pumped 180 kilometers through a pipeline to the Dead Sea.

Will this stop the Dead Sea from shrinking?

“Nonsense,” says Gidon Bromberg simply. As director of the environmental organization Friends of the Earth Middle East, the Israeli lawyer has been involved with issues surrounding the Dead Sea for more than a decade.

What is taking place, Bromberg says, is not a ground-breaking project to save the lake, but simply a water exchange. Israel and Jordan want to build up their water supplies, and the supposedly economically-friendly rescue action is an excellent way to attract international money to do so.

Catastrophic Ecological Consequences

Bromberg is not the only one who thinks like this, primarily because the 200 million cubic meters of brine set to be pumped into the Dead Sea by 2017 at the earliest only make up about 10 percent of the water needed to halt the lake’s retreat.

“The amount of water is not sufficient,” says hydrogeologist Christian Siebert from the Helmholtz Center for Environmental Research in the German city of Halle, who is investigating how the decline of the water level in the Dead Sea is affecting aquifers in the region. “And the environmental consequences are not foreseeable.”

What worries Siebert and environmentalists is the question of what will happen when mixing seawater and lake water.

Experiments carried out by Israeli microbiologists on behalf of the Geological Survey of Israel show that the transfusion of water from the Red Sea could have catastrophic ecological consequences for the Dead Sea. They could include: an uncontrolled growth of red or green algae; the proliferation of bacteria; the lake turning a rusty red color; and the formation of white gypsum crystals on the water’s surface.

“The lake would be completely cloudy,” says hydrogeologist Siebert. It would also be possible that the water from the Red Sea would not mix properly with the water from the Dead Sea because of different densities, but would rather form layers. In the worst case scenario, according to Siebert, microorganisms could establish themselves and convert the gypsum into noxious, putrid, stinking hydrogen sulfide.

The brine produced as the product of desalination is also usually contaminated with chemicals and copper.

Until now, people with skin conditions have been drawn to the Dead Sea because of the healing power of its waters. But who wants to bathe in a foul-smelling lake full of chemical waste?

Siebert and Bromberg agree that anyone wanting to save the Dead Sea must first save the Jordan River. It once supplied the salt lake with its water; now the flow has almost completely dried up. The river, which plays a prominent role in the Bible, is today just a miserable, dirty little trickle.

Water As a Weapon

An incredible 98 percent of the Jordan River’s water is diverted by bordering countries, and more than half of that by Israel. Until two years ago, Syria and Jordan shared the rest; the Syrians have now largely been left out in the cold due to the country’s civil war. The Palestinians claim about 5 percent.

To restore the river, Israel and Jordan would have to do without one-third of its water. It’s a tall order in a region where water is also always a weapon, an instrument of power.

Bromberg, therefore, has a different solution in mind, namely that the chemical companies on the shores of the Dead Sea, and especially the Israeli Dead Sea Works Company and the Jordanian Arab Potash Company, must finally relinquish some of the millions they make selling salts and other minerals.

In order to produce these substances, the firms allow water to evaporate from the salt lake in massive quantities. For this precious water, they pay nothing.

Translated from the German by David Knight.

Source: Der Spiegel.

Pure Water Gazette Fair Use Statement


Ontario’s Grand River loaded with artificial sweeteners, study finds

by Ivan Semeniuk, Science Reporteer

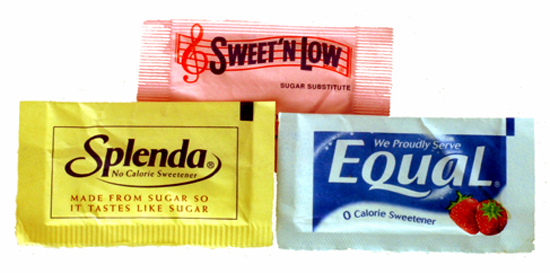
Ontario’s Grand River is so chock full of artificial sweeteners that scientists say the chemicals can be used to track the movement of treated waste in the region’s municipal water supplies.

Artificial sweeteners are used as sugar substitutes in diet drinks and foods.

They impart no calories because they are not readily broken down in the human digestive system, so they tend to exit the body intact.

But that persistence also means the sweeteners linger long after they are flushed away.

They survive processing in waste-water treatment plants, find their way into the environment and reappear in drinking water.

As part of a long-term study, scientists with Environment Canada and the University of Waterloo repeatedly sampled 23 sites along the Grand River system as well as household taps.

Four artificial sweeteners – acesulfame, saccharin, cyclamate and sucralose – were detected, in some cases at higher concentrations than reported anywhere else in the world.

At one site, the researcher calculated that the equivalent of 90,000 to 190,000 cans of diet soda were being consumed each day to account for the quantity of acesulfame they measured.

“If you think about all those cans of pop floating down the river, it’s quite an image,” said Sherry Schiff, a biogeochemist at the University of Waterloo and a co-author of the study, published Wednesday in the open access journal PLOS ONE.

Nearly one million people live in the region, which includes the communities of Kitchener-Waterloo, Guelph, Cambridge and Brantford.

About half of those people rely on the Grand for their drinking water.

While the sweeteners are approved for human consumption and are present in far greater concentrations in diet products, their appearance in drinking water may come as an unnerving surprise to some. The main aim of the study was to see how well the chemicals can be used to keep tabs on where wastewater ends up.

Because of its stability, acesulfame in particular “seems to be perhaps the most ideal tracer of wastewater found so far,” said John Spoelstra, a research scientist at  the National Water Research Institute in Burlington, Ont., and lead author on the study.

Armed with such a tracer, he added, scientists can better spot where human waste is coming into a watershed – not only from municipal water treatment plants, but from septic systems that may be leaking into groundwater. The changing concentrations of the sweeteners can also be compared with that of pharmaceuticals or other chemicals that may pose a health risk but whose pathway and evolution in the water system is not well understood.

“We need a tracer to be able to be able to distinguish dilution effects from actual removal and degradation effects,” Dr. Spoelstra said.

He added that while other researchers have looked at artificial sweeteners in drinking water systems, this is the first time a study has documented their movement on the scale of an entire watershed.

“We’re looking at how sweeteners are accumulating in that water as you move downstream and more and more wastewater is coming into the system,” Dr. Spoelstra said.

The authors stressed that more research is needed to understand the long-term impact of the sweeteners on the environment. Acesulfame, for example, can break down under exposure to ultraviolet light from the sun, producing compounds that are more toxic than the sweetener itself.

The Grand River is the largest Ontario River that drains into Lake Erie.

Why More Isn’t Always Better When You’re Sanitizing A Water Well

by Pure Water Annie

Pure Water Gazette Technical Writer Pure Water Annie clears the water on the troublesome issue of “shocking” a water well.

When a residential water well is “shocked” with chlorine to rid it of bacterial contaminants,  it is usually assumed that just dumping some bleach down the well will do the job.  This article will show you why quantity matters when it comes to adding chlorine to a well and why it is important to follow one of the many good  instruction sheets on well sanitation or to use a chlorine product especially designed for the task.

When chlorine is added to water, it produces hypochlorous acid (HOCl) and hychlorite ions (OCl-).  Hypochlorous acid is by far the most effective and quickest  chlorine ingredient for sanitizing.  It is 80 times as fast and efficient as OCl-.

What is often not considered is that hypochlorous acid is produced most abundantly at a relatively low pH.  Between pH 5 and 7, chlorine as hypochlorous acid acts mainly as a sanitizer–what you need for killing bacteria. As the pH goes up and the water becomes more alkaline, chlorine begins to act more as an oxidizer (what you need for precipitating iron or manganese).

The problem is that when you add calcium hypochlorite (chlorine pellets) or sodium hypochlorite (liquid bleach), you also raise the pH of the water. As the pH goes up, the chlorine loses its sanitizing power.  At pH 9, the chlorine is mainly an oxidizer and will not kill bacteria efficiently.

In a word, over-chlorinating  raises the pH to the point where chlorine does not kill bacteria.

HOCl predominates between pH levels of about 4 and 7.  After 7 it drops off rapidly.

Although acids such as muriatic acid or sodium bisulfate are sometimes used to keep pH low and thus enhance the sanitizing power of chlorine, for homeowners whose wells are in the normal pH range it makes most sense to simply avoid over-chlorinating by following the dosage and procedures put forth by experts in the field.


How Plastic In The Ocean Is Contaminating Your Seafood

  by Eliza Barclay

We’ve long known that the fish we eat are exposed to toxic chemicals in the rivers, bays and oceans they inhabit. The substance that’s gotten the most attention — because it has shown up at disturbingly high levels in some fish — is mercury.

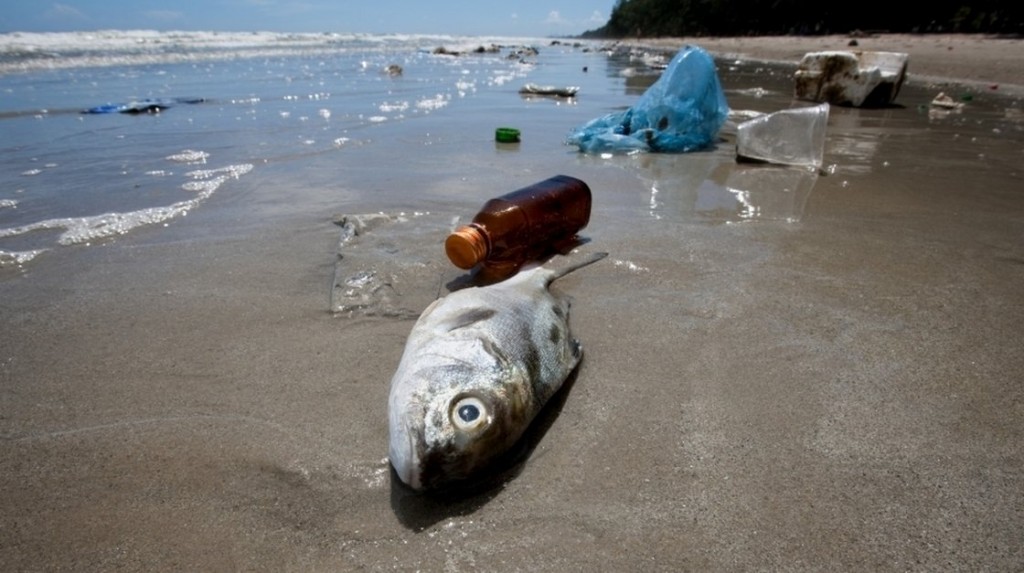
But mercury is just one of a slew of synthetic and organic pollutants that fish can ingest and absorb into their tissue. Sometimes it’s because we’re dumping chemicals right into the ocean. But as a study published recently in Nature, Scientific Reports helps illuminate, sometimes fish get chemicals from the plastic debris they ingest.

“The ocean is basically a toilet bowl for all of our chemical pollutants and waste in general,” saysChelsea Rochman, a postdoctoral researcher at the University of California, Davis, who authored the study. “Eventually, we start to see those contaminants high up in the food chain, in seafood and wildlife.”

For many years, scientists have known that chemicals will move up the food chain as predators absorb the chemicals consumed by their prey. That’s why the biggest, fattiest fish, like tuna and swordfish, tend to have the highest levels of mercury, polychlorinated biphenyls (PCBs) and other dioxins. (And that’s concerning, given that canned tuna was the second most popular fish consumed in the U.S. in 2012, according to the National Fisheries Institute.)

“A lot of people are eating seafood all the time, and fish are eating plastic all the time, so I think that’s a problem,” says a marine toxicologist.

What scientists didn’t know was exactly what role plastics played in transferring these chemicals into the food chain. To find out, Rochman and her co-authors fed medaka, a fish species often used in experiments, three different diets.

One group of medaka got regular fish food, one group got a diet that was 10 percent “clean” plastic (with no pollutants) and a third group got a diet with 10 percent plastic that had been soaking in the San Diego Bay for several months. When they tested the fish two months later, they found that the ones on the marine plastic diet had much higher levels of persistent organic pollutants.

“Plastics — when they end up in the ocean — are a sponge for chemicals already out there,” says Rochman. “We found that when the plastic interacts with the juices in the [fish’s] stomach, the chemicals come off of plastic and are transferred into the bloodstream or tissue.” The fish on the marine plastic diet were also more likely to have tumors and liver problems.


While it’s impossible to know whether any given fish you buy at the seafood counter has consumed this much plastic, Rochman’s findings do have implications for human health, she notes. “A lot of people are eating seafood all the time, and fish are eating plastic all the time, so I think that’s a problem.”

And there’s a lot of plastic out there in the open ocean. As Edward Humes, author of Garbology,told Fresh Air‘s Terry Gross in 2012, the weight of plastic finding its way into the sea each year is estimated to be equivalent to the weight of 40 aircraft carriers.

Consider the five massive gyres of trash particles swirling around in the Indian, Atlantic and Pacific oceans alone. Those gyres, Hume told Gross, contain “plastic that has been weathered and broken down by the elements into these little bits, and it’s getting into the food chain.”

One of those gyres is the infamous Great Pacific Garbage Patch. Fish could encounter the plastic in those gyres, but also much closer to shore, says Rochman.

Even so, the consensus in the public health community still seems to be that the benefits of eating fish — because of their omega-3 fatty acids, among other assets — exceed the potential risks. And many researchers advocating for Americans to increase their fish consumption argue that the levels of dioxins, PCBs and other toxic chemicals in fish are generally too low to be of concern.

The Environmental Protection Agency does put out advisories to warn consumers when fish get contaminated with chemicals in local U.S. waters. But a lot of our seafood now comes from foreign waters, which the EPA does not monitor. Just a tiny fraction of imported fish get tested for contaminants.

As for Rochman, she says her research in marine toxicology has persuaded her to eat seafood no more than twice per week. And she now avoids swordfish altogether.

Source:  National Public Radio.

Pure Water Gazette Fair Use Statement

The difference between concentration and dose

 Editor’s Note:  The following is freely adapted from “The  Basics of Regulatory Toxicology: Protecting the Public from Harmful Substances,” by  Paul Connett.  Dr. Connett’s article addresses specifically the addition of fluoride to drinking water, but the information he presents can be generalized to apply to any toxic substance that is either accidentally or purposely added to drinking water. It should be obvious to anyone who considers the complexity of attempting to medicate the public by adding chemicals to water that adding a potent poison like fluoride to a public water supply isn’t quite the same thing as adding iodine to table salt. — Hardly Waite.

Concentration is measured in milligrams (mg) of fluoride per liter (1 mg/liter = 1 part per million or ppm). This can be controlled at the water works. Dose is measured in mg/day and this cannot be controlled as it depends on how much someone drinks – and some drink a lot – and how much fluoride they are getting from other sources. It is the total dose that has the potential to harm someone. The concentration (mg/liter) offers no guarantee of safety.

The difference between dose and dosage

The same dose (mg/day) can have different affects on different people. There are two reasons for this:

1) because in a large population there is a large range of sensitivity to any toxic substance,  and

2) because the same dose can have a very different affect on people of different bodyweights.  This is especially relevant when comparing the impacts of the same dose on adults and infants. That is why toxicologists use a different measure called dosage. In this they take account of bodyweight by dividing the dose in mg/day by the adult’s average bodyweight of 70 kg.

Thus supposing it was determined that 7 mg/day was safe for an adult (for some health end point), then the safe dosage (sometimes referred to as a safe reference dose) which can be applied to anyone of any weight including an infant, would be 0.1 mg/kg bodyweight per day.  (7mg/day divided by 70 kg = 0.1 mg/kg/day.)

Going from safe dosage to safe dose for a particular bodyweight

From a safe dosage we can work out a safe dose for any age range by multiplying the safe dosage by the average bodyweight for that age range. Thus for a 7 kg infant the safe dose for this hypothetical situation would be 0.7 mg/day and for a 20 kg child it would be 2 mg/day.

The EPA’s Iris Reference Dose (Dosage)

Going back to the real world. The (EPA) determined a safe reference dosage (for the end point of moderate dental fluorosis) of 0.06 mg/kg/day (the so-called IRIS reference dose). Using this Iris reference dose we can determine the safe dose for a bottle-fed infant – at least for dental fluorosis. Assuming an average bodyweight of 7 kg, the safe dose would be 7 kg x 0.06 mg/kg/day = 0.42 mg/day.

A 7 kg infant drinking 800 ml of formula per day made up with fluoridated water at 1 ppm, would receive 0.8 liters x 1 mg/liter/ day = 0.8 mg/day. In other words a bottle-fed baby consuming water at 1 ppm fluoride would get about twice the safe dose based upon the EPA’s IRIS safe reference dose.

The Agency for Toxic Substances and Disease Registry’s safe reference dosage for bone

ATSDR’s reference dosage for the end point of bone damage was set at 0.05 mg/kg/day. A 70 kg adult would exceed this safe reference dosage if they ingested more than 3.5 mg/day (0.05 mg/kg/day x 70 kg = 3.5 mg/day). Such an adult could exceed this safe reference dosage by

i) drinking 3.5 liters of water at 1 ppm (3.5 L x 1 mg/Liter/day = 3.5 mg/day)

ii) drinking 2.5 liters of water at 1 ppm and getting 1 mg/day from other sources.

iii) drinking 1.5 liters of water at 1 ppm and getting 2 mg/day from other sources.

A U.S. Department of Health and Human Service’s (DHHS) report from 1991 estimated that the range of exposure of the American adult was 1.6 to 6.6 mg/day from all sources.

The large range of sensitivity to any toxic substance

In any large population we can anticipate a very large range of sensitivity to any toxic substance. Like other human traits such sensitivity follows a normal distribution curve (the famous bell-shaped curve). The average person will have an average response but at the two tails – we will have people who are very sensitive at one end and very resistant at the other. Typically we assume some people are going to be 10 times more sensitive than others. This is then used to generate a safety factor of 10 (sometimes referred to as the intra-species safety factor).

Thus if we find harm in a small human study and wish to determine the level that would protect everyone in a large population from that harm this is what we do. We take the dose, which has been found to cause no harm (the so-called no observable adverse effect level or NOAEL) and divide that dose by 10 to give a safe dose for the most sensitive individual in the population. Frequently we don’t have a NOAEL and so we have to use a LOAEL (the lowest observable adverse effect level) and divide that by 100. Sometimes this process is corrupted and it is the LOAEL not the NOAEL that is divided by 10.

Margin of Safety Analysis

Applying these calculations in a real world situation is called a Margin of Safety Analysis and shockingly it is very seldom considered by people who promote fluoridation. They simply use the very crude and highly misleading approach of comparing the concentration used in the study group with the concentration of the fluoride in the water of the fluoridated population as discussed above.

An example of a Margin of Safety analysis using an IQ study

Here I will attempt a real world calculation for lowered IQ. I will use the study by Xiang et al. 2003 who reported a threshold for lowering of IQ at 1.9 ppm of fluoride in the water.

Our first task is to estimate the dose range this represents for the children in the study – which of course, will depend on how much water they drink and how much they get from other sources. We believe very few of these rural Chinese children use fluoridated toothpaste and thus their daily dose comes largely from the water.

• If they drank 2 liters of water per day at 1.9 mg/liter their daily dose would be (2 L x 1.9 mg/L ) = 3.8 mg/day.

• If they drank 1 liter of water per day their daily dose would be 1.9 mg/day

• If they drank 0.5 liters of water per day their daily dose would be approx 1 mg/day.

In other words a reasonable estimate of the range of dose leading to a lowered IQ was approximately 1- 4 mg/day.

If we treat this as a NOAEL the safe range of doses of fluoride to protect the most sensitive child in a large population would be 0.1 to 0.4 mg/day (1-4 mg/day divided by 10). In other words we wouldn’t want a child in a large population drinking more than 400 ml (0.4 L) of water (0.4 liters/day x 1 mg/liter = 0. 4 mg/day).

If the Xiang’s et al. study is valid a responsible regulatory authority would not allow water fluoridation. Little wonder then that fluoridation promoters are doing everything they can to criticize the methodology of the Xiang et al. study and the methodology of all the other 36 studies (out of 43) that have found a lowering of IQ associated with drinking naturally occurring fluoridated water ranging from 0.9 to 11.5 ppm.

Fourteen of the studies, ten of which were part of the 27 studies reviewed in the meta analysis carried out by the Harvard team (Choi et al., 2012), found a lowering of IQ at or lower than 3 ppm. Using the same calculation as above the lowering of IQ was associated with a range of fluoride from 1.5 – 6 mg/day in these fourteen studies. Thus dividing by the safety margin of 10 a dose estimated to be safe for the most sensitive child in a large population would range from 0.15 to 0.6 mg/day.

Even if we take the highest (i.e. least conservative) estimate, such a dose would be exceeded by a child drinking about two large glasses of 1 ppm fluoridated water per day (it could be worse than that because I am using these doses as NOAELs and not LOAELs).

US EPA Office of Water is Not Doing its job.

Using a large amount of taxpayers’ money the US EPA paid the NRC to do the review of their safe drinking water standards discussed above. When the NRC panel released its report in March 2006 it concluded that the EPA’s current safe drinking water standard of 4 ppm (both the MCL and the MCLG are set at 4 ppm) were not protective of health. The panel recommended that the EPA Office of Water perform a new risk assessment and determine a new safe MCLG (maximum contaminant level goal).

The difference between an MCL and an MCLG

The MCL (or maximum contaminant level) for the contaminant in question is a federally enforceable standard and for fluoride it was set at 4 ppm in 1986 by the EPA Office of Water.

The MCLG (or maximum contaminant level goal) is a goal based upon the best science as far as determining harm is concerned with a margin of safety analysis applied sufficient “to protect the most vulnerable from known and reasonably anticipated health effects.” As the name suggests this is not a standard but an ideal goal. Incredibly this was also set at 4 ppm for fluoride in 1986.

What frequently happens for naturally occurring contaminants (e.g. arsenic) is that the economic costs of removing the contaminant to the desired goal (i.e. MCLG) is prohibitively expensive and so a compromise is set between the ideal goal and what can be achieved economically. It is this compromise level, which is the MCL. For arsenic – because it is a known human carcinogen – the MCLG is set at 0. The MCL is set at 10 parts per billion (ppb).

The EPA has not determined a new MCLG after 7 years

It is extremely disturbing that after nearly 7 years the EPA’s Office of Water has not completed the needed risk assessment to determine a new MCLG.

Had the EPA used any one of several end points finding harm in the NRC (2006) review (but particularly the IQ studies) and performed an appropriate margin of safety analysis as discussed above a new MCLG would have to be set well below 1 ppm and thus end water fluoridation immediately. However, it may be that the EPA’s Office of Water is not anxious to remove the rug from under the program that the DHHS (or its preceding agencies) have championed for over 68 years.

Going from a safe reference dose to an MCLG for fluoride

Once one has determined a safe dose sufficient to protect for the full range of sensitivity in a large population the following steps are needed to determine a safe drinking water standard or in this case the MCLG (the maximum contaminant level goal).

We will use another real world example. As explained above using the 14 IQ studies that found a lowering of IQ at 3 ppm or lower a conservative safe dose would be 0.6 mg/day (actually more conservatively it would be 0.15 mg/day).

Now we would have to subtract from this the dose ingested from other fluoride sources. For many children this would be well over 0.6 mg/day (from swallowing toothpaste and food sources). Thus the regulatory agency would have to conclude that given current exposures to fluoride no extra fluoride could be condoned. Thus the MCLG would have to be set at ZERO ppm (like arsenic and lead) – and that dear readers would be the end, finito, morte for water fluoridation!*

This looks like a clear example of bad politics keeping fluoridation afloat. If you can follow the above arguments you will understand this and be in a better position to argue the case.

Given a fair hearing, an application of honest and standard risk assessment procedures and an open-minded judge fluoridation would be over. It is a matter of simple arithmetic and scientific integrity. There’s the rub. Between that arithmetic and this result are powerful political forces who – for reasons I for one cannot fathom – feel the need to keep this practice alive at any cost. That cost today probably includes the lowering of the IQ of our children.

The shift in IQ maybe small, but as Philippe Grandjean (one of the authors of the Harvard meta-analysis by Choi et al, 2012) in his new book (Only Once Chance) explains, a small shift in IQ in the whole population is incredibly serious. For example, a negative shift of 5 IQ points would halve the number of geniuses in our society and double the number of mentally handicapped.

*Completing the MCLG calculation

Had the number after subtraction of other sources of fluoride from the safe dose yielded a number greater than zero then a MCLG would be determined on the basis of an estimate of how much water people drink per day. Typically the EPA assumes that the average person drinks 2 liters of water per day. However, this assumption does not protect a higher-than-average water drinker. Thus at this point the EPA would have to determine what percentage of the population it wishes to protect.

In the 1986 derivation of the MCLG the EPA derived a safe dose of 8mg/day. Then ignoring other sources of fluoride, they assumed an average water consumption was 2 liters per day and thus declared that 4 mg/liter was a safe level. i.e. if someone drank two liters of water at 4 ppm per day they would get 8 mg/day, 2 L/day x 4mg/L = 8 mg / day.


New report: Unregulated contaminants common in drinking water

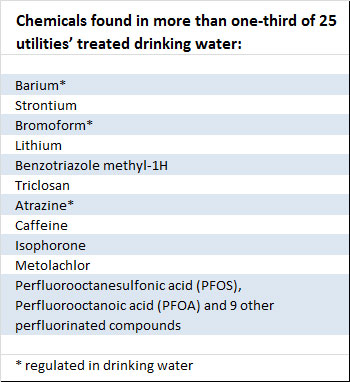
By Brian BienkowskiTraces of 18 unregulated chemicals were found in drinking water from more than one-third of U.S. water utilities in a nationwide sampling, according to new, unpublished research by federal scientists. Included are 11 perfluorinated chemicals, an herbicide, two solvents, caffeine, an antibacterial compound, a metal and an antidepressant.


Traces of 18 unregulated chemicals were found in drinking water from more than one-third of U.S. water utilities in a nationwide sampling, according to new, unpublished research by federal scientists.

Included are 11 perfluorinated compounds, an herbicide, two solvents, caffeine, an antibacterial compound, a metal and an antidepressant.

Researchers from the U.S. Geological Survey and the Environmental Protection Agency analyzed single samples of untreated and treated water from 25 U.S. utilities that voluntarily participated in the project.

Twenty-one contaminants were detected – mostly in low concentrations of parts per trillion – in treated drinking water from at least nine of the utilities. Eighteen of the chemicals are not regulated under the federal Safe Drinking Water Act so utilities do not have to meet any limit or even monitor for them.

“The good news is the concentrations are generally pretty low,” said Dana Kolpin, a research hydrologist with the USGS who participated in the study.

“But,” he added, “there’s still the unknown. Are there long-term consequences of low-level exposure to these chemicals?”

For many of the contaminants, little is known about any potential human health effects of low doses. But one of the perfluorinated compounds, known as PFOA, has been linked to a variety of health problems, including cancer, among people in communities where water is contaminated by a chemical plant in West Virginia.

Of 251 chemicals, bacteria, viruses and microbes the scientists measured, 117 were not detected in any of the treated drinking water. Twenty-one were found in water from more than one-third of the 25 utilities (nine or more) and 113 were found in less than one-third (eight or fewer).

EPA research chemist Susan Glassmeyer, who led the project, said the utilities, which remain anonymous, represented a mix of large and small, and used different water treatment technologies.

Preliminary findings of the study, which is expected to be published next year, were presented by the scientists at a toxicology conference in Nashville last month.

While studies increasingly report newly emerging contaminants in wastewater, there has been little data on which ones are in drinking water.

Four of the chemicals found in the samples – the metal strontium, the herbicide metolachlor, PFOS and PFOA – are on the EPA’s list of chemicals under consideration for drinking water standards. The EPA plans to make decisions regarding at least five of the contaminants on its list next year.

“We’re hoping through this work the EPA will do a much more intensive contaminant candidate list and develop new methods and requirements for drinking water plants,” said Edward Furlong, a scientist with the USGS who participated in the study.

Perfluorinated chemicals, which were found most frequently, are widely used in a variety of industrial processes, including manufacture of some nonstick and stain-resistant food packaging, fabrics and cookware.

The two most common perfluorinated compounds, PFOS and PFOA, in the utilities’ water have been detected in the blood of nearly all people in the United States.

panel of scientists has concluded that there is a “probable link” between PFOA in drinking water and high cholesterol, ulcerative colitis, thyroid disease, testicular cancer, kidney cancer and pregnancy-induced hypertension. The findings were based on people in Mid-Ohio Valley communities whose water was polluted with PFOA from a DuPont plant.

PFOS, used in Scotchgard until 3M phased it out in 2002, has been linked to attention disorders in children and thyroid disease in men.

The EPA has classified metolachlor as a possible human carcinogen based on studies of highly exposed rats. Strontium can affect bone growth, according to some animal studies that used doses much higher than those found in drinking water.

The perfluorinated compounds were at similar concentrations in the untreated and treated drinking water, suggesting that treatment techniques are largely unsuccessful. Only one plant was successful at removing them, and it used activated carbon treatment.

Activated carbon, ozone and UV treatments are generally better at removal than traditional chlorine treatment, but such techniques are often prohibitively expensive, Glassmeyer said.

“People resent having to pay anything for water,” she said. “There’s the thought that there’s a God-given right to have as much as we want but, if you want the cleanest water, these techniques take money.”

Treatment also can sometimes transform compounds into new ones, said Laurel Schaider, a research associate at the Harvard School of Public Health.

“Chlorination and other treatments technologies will remove some contaminants, but will react with others,” Schaider said. “Some compounds may appear to be removed but may be transformed to a chemical we know even less about.”

Source: Environmental Health News.

Pure Water Gazette Fair Use Statement

Half a Million Cubic Kilometers of Fresh Water Can Be Found in Aquifers Beneath the Ocean’s Floor


Lead author Vincent Post, from Australia’s Flinders University, said that an estimated 500,000 cubic kilometres (120,000 cubic miles) of low-salinity water had been found buried beneath the seabed on continental shelves off Australia, China, North America and South Africa.

“The volume of this water resource is a hundred times greater than the amount we’ve extracted from the Earth’s sub-surface in the past century since 1900,” said Post of the study, published in the latest edition of Nature.

“Freshwater on our planet is increasingly under stress and strain so the discovery of significant new stores off the coast is very exciting.

“It means that more options can be considered to help reduce the impact of droughts and continental water shortages.”

UN Water, the United Nations’ water agency, estimates that water use has been growing at more than twice the rate of population in the last century due to demands such as irrigated agriculture and meat production.

More than 40 percent of the world’s population already live in conditions of water scarcity. By 2030, UN Water estimates that 47 percent of people will exist under high water stress.

Post said his team’s findings were drawn from a review of seafloor water studies done for scientific or oil and gas exploration purposes.

“By combining all this information we’ve demonstrated that the freshwater below the seafloor is a common finding, and not some anomaly that only occurs under very special circumstances,” he told AFP.

The deposits were formed over hundreds of thousands of years in the past, when the sea level was much lower and areas now under the ocean were exposed to rainfall which was absorbed into the underlying water table.

When the polar icecaps started melting about 20,000 years ago these coastlines disappeared under water, but their aquifers remain intact — protected by layers of clay and sediment.

Post said the deposits were comparable with the bore basins currently relied upon by much of the world for drinking water and would cost much less than seawater to desalinate.

Drilling for the water would be expensive, and Post said great care would have to be taken not to contaminate the aquifers.

He warned that they were a precious resource.

“We should use them carefully: once gone, they won’t be replenished until the sea level drops again, which is not likely to happen for a very long time,” Post said.
Souce: BusinessInsider.com

Pure Water Gazette Fair Use Statement

CDC: Tainted drinking water at Camp Lejeune in NC linked to birth defects, childhood cancer

  by Michael Biesecker and Allen G. Breed

The authors of the study on Camp Lejeune released late Thursday by the CDC’s Agency for Toxic Substances & Disease Registry warned it is based on a small sample size and cannot prove exposure to the chemicals caused specific individuals to become ill.RALEIGH, North Carolina — A long-awaited study by the U.S.Centers for Disease Control and Prevention shows a link between tainted tap water at a U.S. Marine Corps base in North Carolina and increased risk of serious birth defects and childhood cancers.

But the study did conclude that babies born to mothers who drank Lejeune tap water while pregnant were four times more likely than women who lived off-base to have such serious birth defects as spina bifida. Babies whose mothers were exposed also had a slightly elevated risk of such childhood cancers as leukemia, according to the results.The study surveyed the parents of 12,598 children born at Lejeune between 1968 and 1985, the year most contaminated drinking water wells were closed. They reported 106 cases of serious birth defects and childhood hematopoietic cancers. Of those, researchers said they could obtain medical records to confirm the diagnoses in only 52 cases.

Epidemiologist Richard W. Clapp, who serves on a federal board that has reviewed the Lejeune contamination, said the links found through the study might “appear to be weak” due to the relatively small sample size. But he said the findings are important because they show strong evidence the water that Marines and their families drank, cooked with and bathed in might have made some sick.

“The fact that there was anything found is pretty important,” said Clapp, professor emeritus at Boston University’s School of Public Health. “This is an insensitive tool that we use here, these epidemiological studies. So the fact that they found anything is sort of remarkable.”

The study looked back through time and was designed to see if there was a link between exposure to certain chemicals and certain health problems that developed later. This type of study is often used to investigate disease outbreaks, when health officials are trying to identify possible reasons for the illnesses.

There are no records to measure how much tainted water those surveyed consumed. Therefore, the study had to use complex modeling to gauge how much of the chemicals they could have been exposed to. The study also did not look at the health effects on adults that drank the water. More than 80 men with Lejeune ties have been diagnosed with an extremely rare form of breast cancer.

In the nearly three decades since the contamination was first disclosed to the public, military officials have repeatedly issued public statements downplaying health risks from drinking the tainted water prior to the closure of the most contaminated wells.

A brief statement issued Thursday by Lejeune spokeswoman Capt. Maureen Krebs contained no such disclaimers. It stressed that the water currently flowing from the base’s taps is routinely tested and safe to drink.

“These results provide additional information in support of ongoing efforts to provide comprehensive science-based answers to the health questions that have been raised,” the statement said. “The Marine Corps continues to support these initiatives and we are working diligently to identify and notify individuals who, in the past, may have been exposed to the chemicals in drinking water.”

Krebs said Friday she could provide no comment about the new report beyond the written statement.

Records reviewed by The Associated Press show military authorities continued to rely on the wells for years after testing suggested the water was contaminated. The most highly contaminated wells were closed in 1984 and 1985, after a round of more extensive testing found dangerous concentrations of toxins associated with degreasing solvents and gasoline.

A prior CDC study cited a February 1985 level for trichloroethylene of 18,900 parts per billion in one Lejeune drinking water well — nearly 4,000 times today’s maximum allowed health limit of 5 ppb. Testing also found high levels of benzene, a fuel additive.

The ground water contamination was traced to two primary sources: a leaky on-base fuel depot and an off-base dry cleaner. In prior public statements, Marine officials have emphasized the contamination that came from outside the base. But the newly released study found the greatest negative health impacts to be associated with benzene, which came from the on-base Hadnot Point tank farm built during World War II.

Last year, President Barack Obama signed the Camp Lejeune Veterans and Family Act to provide medical care and screening for Marines and their families, but not civilians, exposed between 1957 and 1987. The law covers 15 diseases or conditions, including female infertility, miscarriage, leukemia and multiple myeloma, as well as bladder, breast, esophageal, kidney and lung cancers.

The law was passed after years of advocacy by former Marines who blamed the contamination for negative health impacts, efforts that were often met with strong resistance from the Marine Corps.

Jerry Ensminger, a former Marine drill instructor, lost his 9-year-old daughter Janey to leukemia in 1985. He is among those with pending federal compensation claims have been on hold while waiting for the CDC research to be completed.

He said the study results are a vindication of what he’s been saying for nearly 20 years, but they won’t bring his daughter back.

“Nothing ever gives you comfort when you lose a child,” Ensminger said Friday. “I think that’s the worst thing that can happen to a human being … to watch them go through the hell they go though. That’s something that never leaves you.”


Source: TribTown.com

Pure Water Gazette Fair Use Statement

Wastewater Case Raises the Concept of Underground Trespassing

By Jim Malewitz

A case involving the disposal of industrial wastewater pits two interests that are dear to many Texans against each other: oil and gas resources versus private property rights.

A decision by the state’s highest civil court could have major implications for both. The Texas Supreme Court is scheduled to hear arguments on Jan. 7 in a dispute between a company that operates injection wells in Liberty County and a nearby rice farm that says wastewater from those wells has migrated into a saltwater aquifer below its land. It calls the migration trespassing, for which it should be compensated. Among several smaller questions, the court will weigh a broad one: Just how far below the earth’s surface do property lines extend?

“This is the classic battle between the two quintessential values that are in direct conflict with each other,” said Matthew J. Festa, a professor at the South Texas College of Law. “On a lot of different levels, this case could make some new law.”

This is not the first time oil and gas interests have clashed with landowners in Texas. State courts have weighed in on several such showdowns in recent years, including eminent domain cases involving land seized to build pipelines. But the court has yet to consider the idea of underground trespassing.

The dispute, which has reached the high court once before, has drawn the oil and gas industry’s attention.

The well in question is classified as Class I and used for nonhazardous industrial waste. It is not one of the 50,000 Class II waste wells that drillers typically use. But lower courts’ opinions have drawn no distinction between the wells, stirring concerns that a ruling in F.P.L. Farming’s favor would harm production.

“Because the ability to produce oil and gas is inextricably tied to the availability of injection wells,” the Texas Oil and Gas Association says in a brief, “a new common law cause of action that threatens operation of injection wells likely threatens oil and gas production.”

In 1997, Environmental Processing Services finished drilling an injection well about 400 feet from F.P.L. Farming’s land, which the farm contested early on. Since then, the company has injected more than 100 million gallons of wastewater.

Bob Kent, a former Texas environmental regulator and F.P.L. Farming’s expert witness, testified that the waste plume had probably traveled across the property lines, basing those conclusions on a formula widely used by state and federal regulators.

Representatives of the farm say they worry that the waste, which includes the flammable liquid acetone, will contaminate its groundwater and erode the value of its property. Though the water is too salty to drink, those on the farm’s side contend that it is valuable because desalination technology could make it drinkable.

The well operator and its supporters, meanwhile, say the waste will make the groundwater no more polluted than it is naturally. And they say it is a moot point because recognizing a subsurface trespassing argument is nearly unprecedented. The appellate court in Beaumont is the only court to have done so.

The suit is flying under the radar of property rights advocates. No group has filed a brief in support of the rice farm, but the Texas Farm Bureau, which typically supports landowners in such disputes, said it was looking at the case after recently learning of its return to court. (The Texas Farm Bureau is a corporate sponsor of The Texas Tribune.)

The group supported F.P.L. Farming the last time the case reached the Supreme Court. That was in 2011, when the justices remanded the case to the lower courts after considering various arguments.

“We think they own the property down to the center of the earth,” said Regan Beck, assistant general counsel for the Farm Bureau, adding, “You have a taking without compensation.”

Source: The Texas Tribune (New York Times).

Pure Water Gazette Fair Use Statement