TDS

by Gene Franks

TDS stands for “Total Dissolved Solids.”  Solids might also be called dissolved minerals, ionic species, or salts. TDS is usually measured in ppm (parts per million) or mg/L (milligrams per liter), which are essentially the same.  TDS is, in short, a measurement of all the dissolved mineral content of the water. A test for TDS does not measure chemicals or pathogens; a low TDS count does not mean that water is safe to drink.

TDS is measured often by laboratories with a conductivity meter, which quantifies the water’s ability to conduct electricity. The higher the mineral content, the better it conducts electricity. For more practical purposes, a TDS meter, which works on the same principle, is used. Conductivity is read in micromhos per centimeter. The familiar TDS meter, an inexpensive and very handy tool, converts conductivity to ppm TDS for convenience.


 The TDS Tester is an effective tool that gives an instant reading of any water. Just turn it on and insert the bottom part of the tester into the water. More information.

There is often confusion about TDS meters and what the readings mean. TDS meters measure the performance of reverse osmosis units, distillers, and deionizers, but except for limited use by professionals, they do not measure the performance of filters or water softeners. Softeners and filters do not affect TDS readings significantly. A softener, to illustrate, removes calcium and magnesium ions but the TDS reading will not be affected significantly because the softener adds a more-or-less equal amount of sodium in exchange. The TDS reading of softened water is usually slightly higher than the TDS of the untreated water. You need a hardness test to judge softener performance, not a TDS meter. Filters, especially when they are new, usually add TDS (the phenomenon is called “TDS throw”). Likewise, the performance of softener alternatives, either tank-style or electronic, cannot be measured by a TDS meter.


Classifying Water by TDS


Although other TDS classifications  may differ slightly, here is a good basic TDS breakdown from a publication of the Water Quality Association of America:

Water Type

TDS, in mg/L

Fresh Water

<1,000

Brackish Water

1,000-5,000

Highly Brackish Water

5,000-15,000

Saline Water

15,000-30,000

Sea Water

30,000-40,000

Brine

40,000-300,000+

Note that in standard usage these classifications are applied loosely. “Brine,” is used in water treatment for the salty water used to regenerate a softener or for the reject water from a reverse osmosis unit. In the case of the RO unit, the “brine” (a.k.a. “concentrate”) could be less than 50 mg/L in TDS. And although the song says that the moon was bright and shiny out on the briney,  even sea water doesn’t technically qualify as brine. Similarly, saline often means any salty solution,  and brackish is often used just to mean really bad water without specific reference to its TDS.

The EPA suggests an upper TDS limit for drinking water of 500, although many cities exceed this limit without dire consequences. For residential water use, when water gets above 1,000 TDS it is starting to border on being unusable, although some well owners grit their teeth and put up with problems like badly stained fixtures, stopped up plumbing, or water so high in sodium that it isn’t good for plants. Actually fairly high TDS water can be usable but it isn’t pleasant to deal with.

Hardness does not always result from high TDS. In our area in Texas, for example, much of the well water is high in sodium but naturally soft. If water has a TDS of 600 and a hardness reading of 2 grains (about 35 ppm), you can be virtually certain that it has a lot of sodium in it. If the high TDS consists mainly of calcium and magnesium (the hardness minerals), it can be softened, but the resulting water will be high in sodium.

Treating High and Low TDS

Treating low TDS is not common, but it can be done by using filters with a sacrificial medium like calcite. As water passes through the filter, it dissolves some mineral content and the TDS goes up. This can be done for point of entry (whole house) or point of use (drinking water only) applications. Small filters are now often used to “remineralize” reverse osmosis water. Minerals are dissolved by the low TDS water passing through the filter, raising the TDS count.

Lowering TDS is done by reverse osmosis, the most common method used in residential settings, distillation, or deionization. Reverse osmosis reduces TDS 90%+ (99% for larger, high pressure units), while distillation and DI (deionization) units can reduce TDS to a zero meter showing. Filters do not reduce TDS, not even the extremely tight ones.

Practical TDS Tips for Residential RO Users

The main use for a handheld TDS tester is to verify the performance of your RO unit’s membrane. While TDS is not in itself a targeted “contaminant” like lead, arsenic, or nitrates, the TDS meter verifies the health of the RO membrane. If the RO unit is reducing dissolved solids by 90%, you can be sure it’s also doing a good job on aluminum and fluoride.

The purpose of the TDS test is to tell you when to change your membrane. If you have an excellent TDS reading, that does not mean you don’t need to change your filter cartridges. The membrane should be changed on need—as indicated by the TDS test—but cartridges are changed on time. In fact, keeping the cartridges fresh is the best way to protect your membrane.

The worst time to do a TDS test is immediately after changing your filter cartridges. The new carbon postfilter will produce a “TDS throw” that will make your TDS reading high. Take a TDS test before you change your cartridges. The same principle applies to new RO units. You won’t get a reliable TDS test until the unit is a couple of weeks old. If you want to test shortly after installation, take loose the tube going into the storage tank and take your sample there—before the water goes through the post filter.

An acceptable TDS reading is a matter of personal preference. On our residential RO units, we usually change membranes when the unit consistently fails to reduce TDS by 85% or so.

To determine this, test first the tap water from the faucet, then compare it with the water coming out of the RO unit. This is called “% rejection,” and the formula is TDS of tap water minus TDS of RO water divided by TDS of tap water times 100. To illustrate, our local tap water usually runs around 180 TDS. So, if we test an RO system that shows a TDS reading of 15, the arithmetic would be 180 minus 15 = 165 divided by 180 = around 9.16 X 100 = about 92% rejection.

That’s fine.

The best advice is don’t obsess over TDS readings from a home unit. TDS is somewhat fickle and can be changed by variables like water pressure and the amount of water being used. Don’t be too quick to change a membrane if you get one bad test.


Dried up: Poverty in America’s drought lands

By Amy McDonald


In more than two decades working at a Central California food bank, Sandy Beals has never seen anything like this spring.

Last month alone, FoodLink of Tulare County served 22,000 people who came in for food — 5,000 more than it usually serves each month and a 12 percent increase from the same month last year. For Beals, who runs the food bank, the spike in hunger traces back to one thing: drought.

“We didn’t think we would hit a big peak until August, but it’s already started to climb,” Beals says. “And it’s going to get a lot worse” as the end of the crop season normally drives more migrant workers to FoodLink’s services.

Tulare County is just one of the hundreds of counties across the country experiencing drought, including every county in California, according to ratings by theU.S. Drought Monitor. Conditions are such that Gov. Jerry Brown declared a state of emergency in January.

The drought situation is driving up prices nationwide for produce grown in the Golden State’s Central Valley and other agricultural areas stricken by drought, such asKansas, Oklahoma and Texas. And among rising food costs, access to clean water and growing unemployment, the drought’s hardest-hit victims are the country’s poor.

“We like to say we live in the greatest country in the world,” says Melinda Laituri, a geography professor at Colorado State University who specializes in disaster management. “But in many ways, we manifest all the very worst things. (Drought) impacts the everyday life of everyone. But it has more impact on those who have fewer options and fewer choices to make.”

Water poverty

Unlike tornadoes or hurricanes, relative to other natural disasters, drought often goes unnoticed, says historian Elke Weesjes, a disaster researcher at the University of Colorado. And dried-up land has especially devastating effects for those already facing the challenges of poverty.

“Drought doesn’t photograph well because the impact is very much hidden,” Weesjes says. “It’s translated into economic losses and whole communities are affected by drought.”

Laituri agrees.

“Sometimes it’s easier to deal with too much of something — like a flood or a big storm that comes in. It’s something we can respond to rapidly because it’s an event,” she says. “It’s only after several years that we realize we are in a drought.”

In Tulare County, 29.7 percent of residents live below the federal poverty line — making it the most impoverished county in the state and among the highest poverty rates in the nation. The drought has hit Tulare County’s poor particularly hard, especially families like 80-year-old Carmen and Al Almanza. The retired couple were surprised in early April when water simply stopped coming out of their faucet.

They rely on their son, who brings a trash can filled with water to their home three times a week, and grandchildren, who bring them bottled water for drinking.

Local water authorities told the Almanzas their well was dry and they needed to dig about 150 feet deeper — which could cost anywhere from $7,000 to $15,000. The couple, living only on Social Security, say they can’t afford that kind of renovation.

“I just need my well fixed,” Carmen Almanza says. “You can imagine it’s difficult to open the faucet and expect to have plenty of water, and now we don’t.”

The couple’s problem is becoming more common throughout the Central Valley, where 90 percent of residents rely on groundwater. Residents must search elsewhere for water to meet basic needs like laundry, cooking, teeth brushing and showering. Many residents must buy their drinking water from grocery stores up to 15 miles away from their homes or individual bottles of water from convenience stores.

That’s partly because even in places where wells haven’t run dry, much of the groundwater has been contaminated by farming chemicals and low water levels. The problem of water contamination in the Central Valley has existed for decades, but the situation is exacerbated by the drought because less water means higher concentrations of nitrate and arsenic (among other contaminants).

The longer the drought persists, the higher the contamination, says Susana De Anda, executive director of Community Water Center, a California-based nonprofit organization that helps communities access clean water through funding and policy advocacy.

Small communities have little infrastructure to treat water for safe use, and water funding has been prioritized to bigger, more urban water needs. Even if clean water were available, it would be running through antiquated pipe systems that cause contamination, De Anda says.

The contamination also creates a financial burden on residents who have to buy potable water to replace the groundwater they pay for but can’t use.

People in one community in Tulare County spend an average 3.9 percent of their household income on water expenses, according to a pilot study done by CWC. That exceeds the 1.5 percent affordability threshold recommended by the U.S. Environmental Protection Agency. And some households spend up to 10 percent of their income on water alone, De Anda says.

That means some families are spending $100 to $150 a month just on water, says CWC policy analyst Omar Carrillo. He says he knows families who are living on $14,000 a year, paying $100 a month in water bills for contaminated water and then buying bottled water on top of that for drinking. For some, that’s more than they spend on groceries.

“There are trade-offs,” Carrillo says, referring to sacrifices families make to pay for their most basic needs. “They’ll end up without something.”

Community Water Center has been working to help families access safe drinking water since 2006, and De Anda says she sees the state’s drought emergency as an opportunity to leverage emergency federal funding that previously wasn’t available for people who have been without clean water, even years before the onset of the drought.

CWC has made some short-term gains with $4 million in federal grants for emergency water supply in disadvantaged communities. As a result, residents of Tooleville, a small community in Tulare County, will soon receive free bottled water for three years. Other communities are applying for grants to provide free clean water either from vending machines or by delivery. These are short-term solutions, to be sure, but the water provided by emergency funding is a huge relief for families with steep water bills, De Anda says.

Plus, within the next month, Tulare County’s Community Action Agency will begin offering assistance with water bills. It’s a service it typically can’t afford, usually only offering help with electricity and gas bills. But Brown recently signed off on a drought relief package of roughly $686 million, $28.5 million of which is allocated specifically for emergency drinking water and water supply.

Water is food

But the impact of the drought on the Central Valley’s poor isn’t limited to water problems.

Tulare County sits in the center of California’s Central Valley, which supplies up to half of the nation’s fruit, nuts and vegetables, according to the California Department of Food and Agriculture. Prices of produce like avocados, lettuce and grapes have increased dramatically, according to the Bureau of Labor Statistics’ Consumer Price Index, and are only expected to increase.

The price of avocados, for instance, is expected to increase between 17 and 35 cents due to drought,estimates Arizona State University researcher Timothy Richards. Consumers all across the country have felt the impacts of rising food prices, but those costs weigh heavily on the poor, says FoodLink’s Beals.

Families living in poverty spend roughly 21 percent of their household budget on food alone, more than twice the percentage average Americans spend, according to the Bureau of Labor Statistics. And higher prices for healthy foods like fresh produce exacerbate the long-established link between poverty and obesity as low-income families maximize their calories per dollar. Plus, 11.5 million poor Americans live in a low-income area over a mile away from a grocery store, according to a report from the U.S. Department of Agriculture.

Most of the donations FoodLink relies on are food and money that come from the agricultural community, and Beals says even though the drought relief funding allocates $25 million for disaster boxes of food staples like rice, beans and canned vegetables, she mourns the loss of the healthy food donated by farmers in the area. “We pride ourselves on giving fresh produce, but that is no longer true,” she said. “We’re going to be getting less help.”

That’s why De Anda and the Community Water Center are intent to improve policies regarding water. If an apple is food, water is food too, De Anda says. And clean water is where it starts.

Source:  Deseret News.

Earth may have underground ‘ocean’ three times that on surface

Scientists say rock layer hundreds of miles down holds vast amount of water, opening up new theories on how planet formed

by Melissa Davey

After decades of searching scientists have discovered that a vast reservoir of water, enough to fill the Earth’s oceans three times over, may be trapped hundreds of miles beneath the surface, potentially transforming our understanding of how the planet was formed.

The water is locked up in a mineral called ringwoodite about 660km (400 miles) beneath the crust of the Earth, researchers say. Geophysicist Steve Jacobsen from Northwestern University in the US co-authored the study published in the journal Science and said the discovery suggested Earth’s water may have come from within, driven to the surface by geological activity, rather than being deposited by icy comets hitting the forming planet as held by the prevailing theories.

“Geological processes on the Earth’s surface, such as earthquakes or erupting volcanoes, are an expression of what is going on inside the Earth, out of our sight,” Jacobsen said.

“I think we are finally seeing evidence for a whole-Earth water cycle, which may help explain the vast amount of liquid water on the surface of our habitable planet. Scientists have been looking for this missing deep water for decades.”

Jacobsen and his colleagues are the first to provide direct evidence that there may be water in an area of the Earth’s mantle known as the transition zone. They based their findings on a study of a vast underground region extending across most of the interior of the US.

Ringwoodite acts like a sponge due to a crystal structure that makes it attract hydrogen and trap water.

If just 1% of the weight of mantle rock located in the transition zone was water it would be equivalent to nearly three times the amount of water in our oceans, Jacobsen said.

The study used data from the USArray, a network of seismometers across the US that measure the vibrations of earthquakes, combined with Jacobsen’s lab experiments on rocks simulating the high pressures found more than 600km underground.

It produced evidence that melting and movement of rock in the transition zone – hundreds of kilometres down, between the upper and lower mantles – led to a process where water could become fused and trapped in the rock.

The discovery is remarkable because most melting in the mantle was previously thought to occur at a much shallower distance, about 80km below the Earth’s surface.

Jacobsen told the New Scientist that the hidden water might also act as a buffer for the oceans on the surface, explaining why they have stayed the same size for millions of years. “If [the stored water] wasn’t there, it would be on the surface of the Earth, and mountaintops would be the only land poking out,” he said.

Source:  The Guardian.

Pure Water Gazette Fair Use Statement

Plastic Legacy: Humankind’s Trash Is Now a New Rock

By Joseph Castro

Melted plastic trash on beaches can sometimes mix with sediment, basaltic lava fragments and organic debris (such as shells) to produce a new type of rock material, new research shows.

Plastiglomerate.  Click picture for larger view.

The new material, dubbed plastiglomerate, will forever remain in Earth’s rock record, and in the future may serve as a geological marker for humankind’s impact on the planet, researchers say.

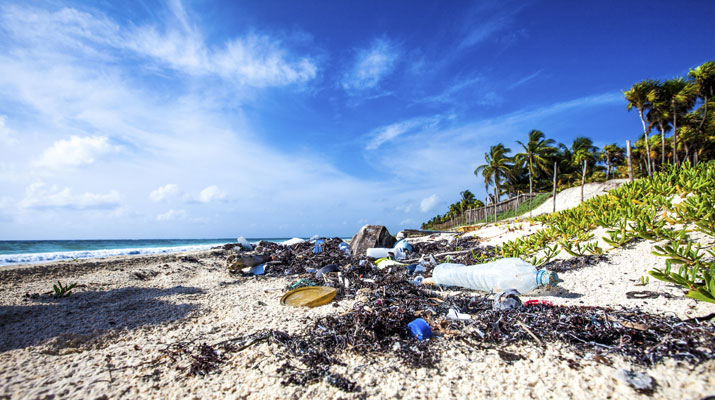
Plastic pollution is a worldwide problem affecting every waterway, sea and ocean in the world, according to the Natural Resources Defense Council. First produced in the 1950s, plastic doesn’t break down easily and is estimated to persist in the environment for hundreds to thousands of years. Plastic debris is also lightweight, allowing it to avoid being buried and becoming a part of the permanent geological record.

But while at Hawaii’s Kamilo Beach, Capt. Charles Moore, an oceanographer with the Algalita Marine Research Institute in California, found that plastic, if melted, can actually become one with rocks, sediment and other geologic materials. [See Images of the Plastiglomerate Rock at Kamilo]

“He found some plastic had been melted to rocks, and other pieces of natural material had also been stuck on it,” said study lead author Patricia Corcoran, a geologist at the University of Western Ontario (UWO) in Canada. “He didn’t know what to call it. It’s possible other people have found [the plastic conglomerates] at other locations before Captain Moore did, but nobody had thought to report it or identify it.”

Corcoran attended a presentation Moore gave about his find, and she became immediately interested in investigating the material. So she, along with Moore and Kelly Jazvac, a visual artist at UWO, headed to Kamilo Beach to analyze the plastic formations.

A human origin

Kamilo Beach, located on the southeastern tip of the Big Island of Hawaii, is often considered to be one of the dirtiest beaches in the world. Because of the current flow and high wave energy of the area, the beach is covered with plastic debris pulled in from the ocean, including fishing gear, food and drink containers and multicolored plastic fragments called “plastic confetti.”

The researchers discovered there are two types of plastiglomerates at Kamilo Beach: In situ and clastic.

In situ plastiglomerate is more rare than the clastic variety, and forms when “plastic melts on rock and becomes incorporated into the rock outcrop,” Corcoran told Live Science, adding that the melted plastic can also get into the rock vesicles, or cavities. Clastic plastiglomerates, on the other hand, are loose rocky structures, composed of a combination of basalt, coral, shells, woody debris and sand that have been glued together by melted plastic.

When Moore first discovered Kamilo Beach’s plastiglomerates, he hypothesized that molten lava had melted the plastic to create the new rock. However, the researchers found that lava had not flowed in that area since before plastics were first invented.

After digging further into the mystery and talking with locals, the researchers concluded that people inadvertently created the plastiglomerates after burning plastic debris, either intentionally to try to destroy the plastic or accidentally by way of campfires.

Given this origin for the beach’s plastiglomerates, the team thinks the material could be present at a lot of other beaches around the world, particularly in areas where people camp or live.

“I would say that anywhere you have abundant plastic debris and humans, there will probably be plastiglomerates,” Corcoran said. Additionally, other locations where there is both active volcanism and beaches polluted with plastic, such as Iceland and the Canary Islands, could have lava-produced plastiglomerates, she said.

A global marker

At present, we live in the Holocene Epoch, which began nearly 12,000 years ago. In recent years, scientists have debated whether to formally identify a new geological era called the Anthropocene, which would mark the time period when human influence significantly altered Earth’s physical, chemical and biological landscape. However, scientists can’t agree when the Anthropocene should begin.

Whatever the case, there are several lines of evidence that highlight humankind’s impact on the planet.

For instance, with the onset of the Industrial Revolution, a lot of carbon dioxide and other greenhouse gases have been pumped into the atmosphere. And even further back, the rise of agriculture some 8,000 years ago fundamentally changed land use and led to increased atmospheric carbon dioxide and methane, as evidenced from analyses of ice cores. Additionally, soil profiles from peat bogs indicate that mining activities and the combustion of leaded gasoline have resulted in increased lead concentrations over the past 300 years, the researchers noted in their study.

With plastiglomerates, scientists now have another global marker for the Anthropocene, Corcoran said. “It definitely shows how humans have interacted with Earth’s biophysical system.”

What’s more, Corcoran and her colleagues have analyzed the clastic plastiglomerates from Kamilo Beach, and found the new material is far denser than plastic-only particles. This suggests plastiglomerates have a much greater potential to become buried and preserved in the rock record than normal plastic debris, and that future generations of scientists will be able to look into the planet’s geological record and find the plastiglomerates.

“One day in the future, people can look at this material and use it as a marker horizon to see that in around 2010, humans were polluting the planet with plastic,” Corcoran said. “But that’s not a legacy we really want.”

Source:  Live Science

Pure Water Gazette Fair Use Statement

Shark meat worse than its bite

By Tony Carnie


Durban – Never mind their fearsome jaws. People are now more likely to be killed by eating shark meat rather than the other way round.

This was the warning from researchers at the Sharks International Conference in Durban, where several new studies showed increasing levels of chemical poison and toxic metals in shark meat when a growing number of the animals are targeted for human consumption.

In her presentation “Sharks may kill you… if you eat them”, Jann Gilbert of Southern Cross University in Australia said recent meat samples from at least three species of shark had levels of arsenic, mercury and other toxic compounds way above the recommended food safety levels.

Gilbert said up to 273 million sharks were killed every year around the world. While a large percentage were destined for the shark fin soup market, shark meat was also used widely for direct human consumption or indirectly in fish meal or fertiliser.

Gilbert’s study was based on toxic metals in dusky, sandbar and great white sharks in south-eastern Australia.

For instance, mercury levels in two of these predator species were 10 times higher than safety levels recommended by the Foods Standards Authority of Australia and New Zealand.

Arsenic pollution was also high, with some sharks containing arsenic concentrations significantly higher than safety recommendations.

Very high levels of arsenic had also been found in hammerhead sharks in the Mediterranean sea in a separate study.

Gilbert said her results were comparable to many other studies from around the world, which indicated that shark meat was becoming increasingly toxic and unsafe for human consumption.

While it was difficult to provide an exact guideline on safe levels for those who consumed the meat regularly, she suggested that most sharks more than 150cm long were “not likely” to be safe for consumption.

Because high mercury levels could damage the brains of developing human babies in the womb, Gilbert would not advise pregnant women to eat shark meat more than once a fortnight.

Kady Lyons, of the University of Calgary, said that apex predators such as sharks were prone to bio-accumulating and bio-magnifying man-made chemical poisons because they were at the top of the food chain, especially if they fed along the coast next to large cities and farming areas.

Some of these toxic chemicals, including DDT and polychlorinated biphenyls (PCBs), were also being passed on to young sharks from the fatty tissues of their mothers.

Mercury threat

Daniel Fernando, a marine biologist from Linnaeus University in Sweden, told the Durban conference that a study of manta rays and other shark-like species in Sri Lanka and China showed high concentrations of mercury and other toxic substances were above international recommendations for human consumption.

The chemicals they found came from a wide variety of human sources, such as wood preservatives, marine anti-fouling agents or insecticides.


In his keynote speech, Dr David Ebert of the Pacific Shark Research Centre in California, said sharks continued to conjure up images of large and fearsome predators with a large dorsal fin cutting through the surface of the sea.

“However, the reality is that sharks come in a variety of sizes and shapes – from the giant whale shark (the world’s largest fish) to the dwarf pygmy sharks.” – The Mercury


Source: iolscitech

Pure Water Gazette Fair Use Statement

What’s Clogging Your Membrane?

by Ryan Lessing, Watts Water Quality

Want to know what’s clogging your commercial RO membranes? The next time your RO stops producing water, try using your senses to determine why.

  • Smell:Does the membrane have a fishy or moldy odor when removed from the housing? If it does it’s likely that bacteria/bio film is present. Cut the membrane lengthwise and unroll it like a roll of paper towels.
  • Feel: The membrane material should feel like clean wet plastic. If there’s slime or a slippery film present it means the membrane could be bio-fouled. If the membrane’s texture feels like sand paper it means a mineral fouling is present.

To test mineral fouling, unroll and dry a sample of membrane, scrape up a sample of the mineral, put it into a beaker, and soak it in RO water with a pH of 4 (adjusted with muratic acid) for one hour. Then readjust the pH back to 7 with baking soda and use a field kit to test for hardness and/or iron. Is hardness present? If yes, your softener isn’t working all the time. Then scrape up a second sample of scale and put a drop of vinegar on it. If it foams it is carbonate; if not it could be sulfate.

  • Sight: Is there discoloration on the membrane surface? A red/brown discoloration indicates possible iron fouling while grey/brown indicates possible silt fouling.

Source: Watts Email Newsletter.

Pure Water Gazette Fair Use Statement

Gluten Found in Portland’s Water Supply

Authorities in Portland, Ore. have discovered detectable levels of gluten in the city’s water supply, causing a citywide panic.

The city’s water bureau discovered the contamination yesterday and is desperately trying to find out how gluten got into the water. A preliminary report found that the contamination may have occurred “at least eight or nine months ago” when a child dropped a loaf of bread into a local river.

Officials have declared a state of emergency and plan to drain all of the city’s reservoirs. The mayor has also deployed city’s spiritual and wellness counselors to provide relief to beleaguered residents who drank the gluten-contaminated water.

“I haven’t seen anything like this since the Tofu Crisis of ‘08, when we discovered that the Pacific Northwest’s entire supply of tofu had been prepared alongside bacon,” said city engineer Bryce Shivers. “I imagine we’re going to be seeing the disastrous effects of this on the city for decades, like higher rates of obesity, cancer, brain damage and illiteracy.

“Or whatever it is that gluten does. Frankly, I have no idea. My Hot Yoga guru just gave me a brochure.”

Make it grain (free)

Gluten, a type of protein in wheats and certain grains, is found in numerous products including flour, pasta, pastries, beer, cereal, salad dressings and lip balm.

Although gluten-free food is recommended for people with celiac disease, it has become a fad diet for many, including millions in trendier-than-thou Portland. Gluten-free foods are becoming mainstream throughout the U.S. — even though very few consumers can explain what gluten is or why they think it’s bad.

“This is the worst news I’ve ever heard,” Portland resident Steve Arlo said as he sat drinking a microbrew made with barley and rye. “It’s like being told they dumped fluoride into the water supply. Wait! Have they dumped fluoride into the water supply?”

Dex Parios said she started her gluten-free diet “before anyone ever heard of it.” Now depressed by the news about the gluten, she is concerned that Portland is losing its reputation for livability and alternative lifestyles.

“When I moved here after getting my master’s degree in order to work part time at a record store, I thought Portland was a haven for intelligent, well-educated and cultured people,” she said. “But it’s so dangerous. Our leaders can’t even protect us from chemtrails, cell phone towers, bark dust fires, Republicans, people trying to talk to you, and now gluten outbreaks. It’s becoming like Baghdad or Afghanistan day by day.

“If I want to live in a city filled with provincial, arrogant, short-sighted morons, I’ll move to Gresham.”

Despite the paranoia gripping Portland’s streets, not all scientists are convinced by the city’s analysis and believe the water bureau has made  a grave error.

“Gluten is not soluble in water, so it’s extremely unlikely to be found in tap water,” says Dr. Chaz Friday of Portland State University. “Nevertheless, just to be on the safe side perhaps hipsters with gluten-sensitivity should move to Seattle instead.”

Source: The Daily Currant

Pure Water Gazette Fair Use Statement

A Guide to Small Inline Water Filters

Small disposable inline water filters provide an easy way to add a water filter almost anywhere.  They can be used as stand-alone filters or can be added to existing filters.

Typical uses:

Refrigerator filter, to remove chlorine or chloramine from city water.

Add-on filter, to raise the pH or add mineral content to water from an undersink reverse osmosis unit.

Add-on filter to protect an existing undersink filter or RO unit from sediment.

The final or “polishing” stage of an undersink reverse osmosis unit.

An inexpensive  independent undersink filter to improve taste and odor of city tap water.

The most common format for small inlines today is with quick connect (a.k.a. John Guest) fittings, but they can still be installed with plastic compression fittings (Jaco style) or conventional copper compression fittings. They come in 6″ length, 10″, and larger.  By far the most popular size is the 10″.  They can be installed with inexpensive clips, or they be laid on the floor, or even, because of their light weight,  installed on a vertical  tube like an undersink faucet line without additional support.

Here are the fitting styles available.


The filter above has what  is currently the most popular connection method. The 1/4″ quick connect above is used widely for refrigerator filters and reverse osmosis postfilters.  Simply push in the tube until it “hits bottom” and the connection is made. This filter comes from the factory with quick connect fittings built in. These are virtually leak proof when used with plastic tubing because when the filter is replaced, the fitting is also replaced.   To release, press in on the collet (the red ring) with your thumbnail or  other release tool and pull the tube out. These fittings can be used with copper tubing, but they work much better with plastic.  The fitting in the picture is a straight-in fitting, but you can make a 90 degree fitting easily by using a socalled a plug-in elbow:


The same filters can be purchased with female threads.  Below is a standard 1/4″ threaded filter:

The threaded filter can be used either with quick connect filters added. with “Jaco” plastic compression fittings, or with standard hardware-store grade metal compression fittings.  Just telflon tape the threaded portion of the fitting and screw it into the filter.

 Metal Compression Fitting


Quick Connect Elbow

Jaco Plastic Compression Fitting

Inline filters can serve as stand-alone taste/odor/chemical filters. They can raise the pH of acidic water. They can protect appliances like coffee makers and ice machines. They can remove lead and heavy metals. They can remove sediment.  Carbon inlines come with standard GAC, coconut shell GAC, and in several carbon block styles.

More information.

Inline filters available from Pure Water Products.


World Oceans Day


Posted June 8th, 2014

World Oceans Day 2014: World’s Most Polluted Seas Revealed

By Ludovica Iaccino

Sunday 8 June is World Oceans Day, an event to raise global awareness about threats to the oceans and promote marine conservation. The special day has been recognised by the United Nations since 2008.

According to World Wide Fund for Nature (WWF), more than 80% of marine pollution is caused by land-based activities that cause oil spills, fertilisers and toxic chemical runoff and the discharge of untreated sewage.

Some water pollution starts also as air pollution, which settles into waterways and oceans, according to the United States’ National Ocean Service.

More than 80% of marine pollution is caused by land-based activities.


IBTimes UK looks at the most polluted oceans areas and seas in the world.

Atlantic Ocean – Gulf of Mexico Dead Zone
The Gulf of Mexico is a basin in the Atlantic Ocean, surrounded by the gulf coast of the United States, Mexico and Cuba.

The dead zone here is one of the largest in the world.

Its waters are full of nitrogen and phosphorous that come from major farming states in the Mississippi River Valley, including Minnesota, Iowa, Illinois, Wisconsin, Missouri, Tennessee, Arkansas, Mississippi, and Louisiana.

The presence of these chemicals frequently turns Gulf of Mexico waters hypoxic, or low in oxygen.

Hypoxia kills fish in huge numbers.

“Hypoxia in bottom waters covered an average of 8,000–9,000 km2 in 1985–92 but increased to 16,000–20,000 km2 in 1993–99,” according to the National Oceanic and Atmospheric Administration.

Atlantic Ocean – North Atlantic Garbage Patch
This patch was first documented in 1972 and is entirely composed of man-made marine debris floating in the North Atlantic Gyre.

Scientists estimate that the North Atlantic Garbage Patch is hundreds of kilometres in size and has a density of 200,000 pieces of trash per square kilometre in some places.

Pacific Ocean – Great Pacific Garbage Patch
Located in the northern Pacific Ocean, near the North Pacific Gyre, this collection of marine debris is largely composed of plastic and chemical sludge.

This patch is believed to have formed gradually as marine pollution was brought together by ocean currents.

The exact size of the patch is unknown, but estimates range from 700,000 sq km (270,000 sq miles) to more than 15 million sq km  (5.8 million sq miles). Because the floating debris is largely composed of microscopic pieces of plastic, it is invisible from space.

The Great Pacific Garbage Patch collects marine debris from North America and Asia, as well as ships travelling through the area.

Rubbish from the coast of North America takes about six years to reach the Great Pacific Garbage Patch, while detritus from Japan and other Asian countries takes about a year.

Indian Ocean
A garbage patch in the Indian Ocean was discovered in 2010. This patch, mainly formed by plastic debris and chemical sludge, is the third major collection of plastic garbage in the world’s oceans.

According to the Indian Ocean Experiment (INDOEX), the Indian Ocean is gravely polluted by plastic debris and chemical runoff, resulting in hypoxia.

INDOEX has documented widespread pollution covering about 10 million sq km (3.86 million sq miles).

According to scientists, tropical cyclones that cause large numbers of deaths around the Arabian Sea (region in the northern Indian Ocean) are becoming increasingly common as a result of pollution.

Mediterranean Sea
The Mediterranean is probably the most polluted ocean in the world.

The United Nations Environment Programme has estimated that 650,000,000 tons of sewage, 129,000 tons of mineral oil, 60,000 tons of mercury, 3,800 tons of lead and 36,000 tons of phosphates are dumped into the Mediterranean each year.

Because it is so enclosed by land, the warm waters of the Mediterranean take more than 100 years to clean and renew themselves, according to Greenpeace.

Due to the high rates of pollution, many marine species are at risk of extinction, among them the Mediterranean Monk Seal, one of the world’s most endangered marine mammals.

Baltic Sea
Overfishing, oil spills and land-based pollution are high threats to the Baltic Sea, situated between Central and Eastern Europe.

Half of the fish species in the Baltic are at levels below the critical biological level.

As it only has a narrow outlet to the ocean – between Sweden and Denmark – its water takes 25-30 years to refresh itself.

The health authorities of Finland have warned against eating some species, such as Baltic herring, from the Baltic Sea.

Caribbean Sea
Located in the northern part of the Atlantic Ocean, the Caribbean Sea is one of the areas most seriously damaged by human activity.

According to a study by the National Centre for Ecological Analysis and Synthesis (NCEAS), oil spills, over-fishing, pollution and climate change are killing marine life. Oyster and sea grass beds, mangroves, fisheries and coral are slowly disappearing.

To find out more about World Oceans Day, head to the official World Oceans Day website.

Source:  International Business Times.

Pure Water Gazette Fair Use Statement

Sierra rises, quakes erupt as Central Valley aquifer drained

by David Perlman

 Are We Creating Earthquakes by Overuse of Water?

The Sierra Nevada is rising.

Drought-stricken farmers in the Central Valley are pumping more and more water from the valley’s huge aquifer beneath them, and the drainage is triggering unexpected earthquakes along the San Andreas Fault, scientists have discovered.

For the past 150 years, they report, periodic pumping from the aquifer has caused the towering Sierra to rebound upward as much as 150 millimeters, or about 6 inches. At the same time, they note, California’s Coast Range, which spans 400 miles from Humboldt to Santa Barbara counties, has grown, although by much less.

The pace of uplift in the Sierra is measured only in millimeters, but when California experienced bone-dry seasons between 2003 and 2010 and pumping increased up and down the Central Valley, the High Sierra rose by about 10 millimeters, the geophysicists say. That’s nearly half an inch during those seven years alone.

During that same period of increased pumping, instruments at Parkfield in Monterey County detected unusual clusters of earthquakes along the quake-prone San Andreas Fault there.

The unexpected links between the periodic drainage of the Central Valley’s aquifer and the rise of the mountains that increase stresses on the San Andreas fault zone are reported in the May issue of the journal Nature.

Its authors are a team of Earth scientists led by Colin Amos of Western Washington University and includes Roland Bürgmann of UC Berkeley and William Hammond of theUniversity of Nevada in Reno.

GPS sensitivity

The remarkable ability to measure tiny changes in the height of mountains is made possible by the extraordinary sensitivity of advanced global positioning systems, similar in principle to the GPS devices that tell car drivers where they’re going in unfamiliar cities, block by block.

Hammond and his colleagues at the Nevada Seismological Laboratory regularly analyze signs of the Earth’s movements from more than 12,000 GPS stations around the world. For this study, the team focused on 566 stations in California and Nevada.

“The whole Earth is elastic,” Hammond said, “and when it moves even slightly we can measure it.”

Amos, the study’s lead author, explained the connections.

“As winter snows melt and rains fill the aquifer each year, the enormous weight of the water pushes the Earth’s crust downward beneath both the valley and the mountains,” he said. “Then as pumping drains the aquifer, particularly in dry years, the crust springs upward – mountains, valleys and all – and the rocks rebound like elastic.”

Amos calculated that the amount of water pumped from the great aquifer since 1860 would be enormous, weighing roughly 175 billion tons, more than enough to fill Lake Tahoe.

‘Real eye-opener’

“The periodic stress on earthquake faults would be very small, but in some circumstances even such small stress changes can be the straw that breaks the camel’s back,” Bürgmann said. “The stresses from the rebounding mountains would give just that extra force needed to unclamp the (San Andreas) fault and encourage, not only small earthquakes, but also larger ruptures to occur.”

“This is a real eye-opener,” said James Famiglietti, a water resource expert and director of the UC Center for Hydrologic Modeling at UC Irvine who has long studied the great aquifer’s long-term drainage issues and its seasonal water losses. He called the study’s conclusions surprising and valid.

“The whole role of fluids and seismicity is still poorly understood. They have identified a real link between human activity and earthquakes,” said Famiglietti, who was not part of the study.

“It forces us to consider not only the role that large groundwater mass changes can play in earthquake frequency, but by extension, the roles of water management decisions in times of drought and climate change.”

Source: SFGate.

Pure Water Gazette Fair Use Statement