Radon In Water:  How it gets there and How to Get Rid of It


 Radon is one of the more perplexing and misunderstood issues in home water treatment.  The material below is excerpted from several sources, especially from an excellent Penn State University Extension services publication.


Radon is a colorless, tasteless, odorless, radioactive gas. It is formed from the decay of radium in soil, rock, and water and can be found worldwide.

The radon in the air in your home generally comes from two sources: the soil or the water supply.  It escapes from the earth’s crust through cracks and crevices in bedrock, and either seeps through foundation cracks or through poorly sealed areas into basements and homes, or it dissolves in the groundwater. Radon can be trapped in buildings where it can increase to dangerous levels. Radon entering your home’s air supply through the soil is typically a much larger risk than the amount of radon   In general, radon is of much greater danger when it enters through the soil than when it enters via the water supply.

Radon can be inhaled from the air or ingested from water. Inhalation of radon increases the chances of lung cancer and this risk is much larger than the risk of stomach cancer from swallowing water with a high radon concentration. Generally, ingested waterborne radon is not a major cause for concern. The extent of the effects and the risk estimates involved are difficult to determine. According to the EPA’s 2003 Assessment of Risks from Radon in Homes, radon is estimated to cause about 21,000 lung cancer deaths per year. The National Research Council’s report, Risk Assessment of Radon in Drinking Water, estimates that radon in drinking water causes about 160 cancer deaths per year due to inhalation and 20 stomach cancer deaths per year due to ingestion.

Radon in water usually originates in water wells that are drilled into bedrock containing radon gas. Radon usually does not occur in significant concentrations in surface waters.

Dissolved radon in groundwater will escape into indoor air during showering, laundering, and dish washing. Estimates are that indoor air concentrations increase by approximately 1 pCi/L for every 10,000 pCi/L in water. For example, a water well containing 2,000 pCi/L of radon would be expected to contribute 0.2 pCi/L to the indoor air radon concentration. Based on the potential for cancer, the EPA suggests that indoor air should not exceed 4 picocuries per liter (pCi/L).

EPA and various states have recommended drinking water standards for radon in water ranging from 300 to 10,000 pCi/L but no standard currently exists. One study of radon present in over 900 Pennsylvania water wells found that 78% exceeded 300 pCi/L, 52% exceeded 1,000 pCi/L and 10% exceeded 5,000 pCi/L.

Since most exposure to radon is from air, testing of indoor air is the simplest method to determine the overall risk of radon in your home. Test kits for indoor air radon are inexpensive and readily available at most home supply stores.

Testing for radon in water is also inexpensive but requires special sampling and laboratory analysis techniques that measure its presence before it escapes from the sample. Test kits are available from various private testing labs

The presence of waterborne radon indicates that radon is probably also entering the house through the soil into the basement which is generally the predominant source. Therefore, treating the water without reducing other sources of incoming airborne radon probably will not eliminate the radon threat. Therefore, you should also test the air in your home for radon.

Treating Radon in Water

The main objective of water treatment is removing radon from water before the radon can become airborne. Most water treatment, therefore, focuses on “point of entry” rather than “point of use.”

Granular Activated Carbon (GAC)

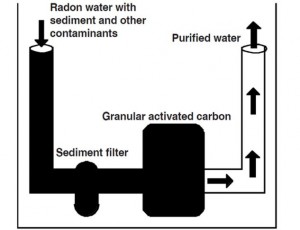
One method for removing radon from water is with a granular activated carbon (GAC) unit. Although these systems come in a variety of models, types and sizes, they all follow the same principle for removal . The standard radon GAC filter is a tank-style unit that can have either a backwashing control or a simple non-backwashing head. Non-backwashing GAC units must be protected from sediment with a prefilter.  Radon filter sizing depends on the amount of radon present, service flow rates, amount of water treated, the size of the treatment bed and other factors, so each application must be considered separately and radon testing for effectiveness of the filter should be carried out regularly.

radontreatmentwithcarbon

Typical setup for a GAC filter treating radon.

Various estimates suggest that GAC should only be used on water supplies with a maximum radon concentration of less than 30,000 pCi/L.  If you do decide to purchase a unit, select a filter size that matches your water use and conditions.  According to EPA, a three-cubic-foot unit can handle as much as 250 gallons of water per day and effectively reduce radon levels. Typical water use in the home ranges from 50 to 100 gallons per person per day.

A major drawback to the use of GAC filters for radon removal is the eventual buildup of radioactivity within the filter. For this reason, the GAC unit should be placed outside the home or  in an isolated part of the basement to minimize exposure. The carbon may also need to be replaced annually to reduce the hazard of accumulated radioactivity. Spent GAC filters used for radon removal may need special disposal.  Disposal of spent carbon should be in compliance with local waste disposal regulations.

GAC treatment units are frequently also installed to remove chlorine, pesticides, petroleum products, and various odors in water. In these cases, the GAC filter may unknowingly be accumulating radioactivity as it removes radon from the water. Radon should always be tested for and considered as a potential hazard with the use of GAC filters.

Aeration

EPA has listed aeration as the best available technology for removing radon from water. Home aeration units physically agitate the water to allow the dissolved radon gas to be collected and vented to the outside. With new technological advancements in home aeration, these units can have radon removal efficiencies of up to 99.9%. Standard aeration treatment units typically cost $3,000 to $5,000 including installation.  Be aware that aeration specifically for radon reduction is not the same as aeration for iron or hydrogen sulfide reduction.  While “closed tank” systems designed for iron and sulfide reduction might help with radon, they are not designed to provide the large ventilation capacity needed to assure release of radon to the atmosphere.

When considering installation of aeration units, other water quality issues must be taken into account, such as levels of iron, manganese and other contaminants. Water with high levels of these types of contaminants may need to be pre-treated in order to prevent clogging the aeration unit. Disinfection equipment may also be recommended since some aeration units can allow bacterial contamination into the water system.

radontreatmenthomespray

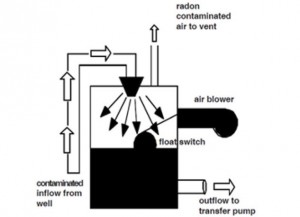
Typical Spray Aeration System Designed  for Radon Reduction in a Private Home

There are several styles of aeration treatment units but all work on the same principle of aerating or agitating the water to allow the radon gas to escape so it can be captured and vented. Each type of unit has advantages and disadvantages. One of the more common styles is a spray aeration unit shown above. In this case, water containing radon is sprayed into a tank using a nozzle. The increased surface area of the sprayed water droplets causes the radon to come out of the water as a gas while the air blower carries the radon gas to a vent outside the home. About 50% of the radon will be removed in the initial spraying so the water must be sprayed several times to increase removal efficiencies. To keep a supply of treated water, a 100-gallon or larger holding tank must be used.

Another common aeration unit is the packed column where water moves through a thin film of inert packing material in a column. The air blower forces radon contaminated air back through the column to an outdoor vent. If the column is high enough, removal efficiencies can reach 95%.

Another type of aeration system uses a shallow tray to contact air and water. Water is sprayed into the tray, and then flows over the tray as air is sprayed up through tiny holes in the tray bottom. The system removes more than 99.9% of the radon and vents it outside the home.  Go here for illustrations of other aeration systems.

See also:  the EPA publication and a list of resources from RadonResources.com.

Main Source:  Penn State University.

Pure Water Gazette Fair Use Statement

Pollution total dumped in lake hits 3.7 billion gallons

by Chad Selwesky

The rain showers of Sunday and Monday created sewage overflows that dumped 79 million gallons into Lake St. Clair, bringing the total pollution this year from sewer systems discharged into the lake to 3.7 billion gallons.


The GWK Drain in Oakland County released 72 million gallons, and the Chapaton sewage basin in St. Clair Shores spilled another 7 million gallons. Both facilities partially treat their discharges by adding chlorine and removing solid waste before releasing them into the waterways.


Brent Avery, operations manager at Chapaton, said the situation could have been worse, as the nearby Martin retention basin and the windy weather also presented concerns.

“We filled to the brim at Martin (basin), but did not discharge” Avery said. “We did not experience a power outage, but it was sure fluctuating.”


The 2014 totals reflect the massive sewage dumping on Aug. 11-12 during the unprecedented flooding experienced across southern Oakland and Macomb counties.


During that time period, the GWK Drain, traditionally known as the Twelve Towns Drain, flushed 2.1 billion gallons of partially treated sewage and rainwater into Macomb County’s Red Run Drain at Dequindre, south of 13 Mile Road. From there, the contaminants flow through residential neighborhoods to the Clinton River and then out to Lake St. Clair.


The Chapaton system, located at 9 Mile Road and Jefferson and operated by the Macomb County Public Works Commissioner’s Office, spewed 166 million gallons when the floodwaters hit.


In addition, the amount of untreated raw sewage dumped into the waters by Macomb County communities during the flood was raised dramatically in the final numbers, from nearly 6 million gallons to 140 million gallons.


At one point earlier this fall, officials estimated that the county’s pollution total would hit 4 billion gallons by the end of the year. Sewage system officials say that the overflows are diluted by rain water and present no danger to the public. At the same time, environmental activists say the E. coli bacteria in the discharges is the main cause of the hundreds of beach closings on Lake St. Clair over the past several years.


Water tainted with E. coli can cause skin rashes, nausea, vomiting or diarrhea and it can lead to exposure to viruses.


The total number of gallons dumped into the lake this year equals the volume of 5,300 Olympic-size swimming pools.

Source: Macomb Daily.

Pure Water Gazette Fair Use Statement

No Black Friday


Posted November 28th, 2014

No Black Friday


Pure Water Products is following its Black Friday closing policy occasioned by a shopping accident sustained during the 2012 shopping season.  Please read details. The company’s retail store in Denton, TX will reopen for business as usual on Saturday December 29.

Excess Lead in New Jersey Town’s Water


Posted November 23rd, 2014


Brick residents sound off on lead in their water

by Kevin Pentón

Gazette Introductory Note:  The lead issue at Brick, New Jersey illustrates a common problem for which “authorities” draw some unrealistic conclusions. The advice to run water for 30 seconds before drinking isn’t really a sustainable alternative to proper treatment for lead.  This is clearly a case where “point of use” treatment is the sensible solution.  The Clean Water Action official’s advice that “most filters on the market won’t properly exclude lead” is essentially true, but what should be added is that many filters, even some very inexpensive ones, do effectively reduce lead.  Reverse osmosis removes lead by its nature, and inexpensive carbon filters can be engineered to remove lead effectively.  It certainly makes a lot more sense to use a “final barrier” drinking water treatment than to continually test your water for lead and scores of other possible contaminants or to trust your fate to running the water for 30 seconds before every glass of water.–Hardly Waite.

BRICK – Township residents are concerned over a recent report that elevated lead levels were found in the water of nearly half the homes tested this summer.

After reading the initial Asbury Park Press story on the issue, resident Michele Richards said she went out and spent over $10 on a lead test. Afterwards, she said she learned she would need to spend at least $30 so a laboratory can analyze the results.

“I pay enough taxes as it is,” Richards said. “I don’t feel like I should have to pay to test my drinking water.”

Water in 16 of the 34 homes tested this summer by the Brick Municipal Utilities Authority was found to have more lead than the maximum amount allowed by the federal Environmental Protection Agency, according to the state Department of Environmental Protection.

At least one home was found to have a lead level of 184.5 parts per billion, more than 12 times the FDA’s cap of 15 ppb.

State and local officials believe the source of the contamination is the pipes and solder inside residents’ homes, not the drinking water supplied by the authority to approximately 38,000 connections.

If the water was coming into homes dirty, then perhaps the authority or the township might have more of a responsibility to pay for individual lead tests, Mayor John Ducey said.

“Unfortunately, the problem is coming from inside residents’ homes,” Ducey said. “It doesn’t make any sense for the town to pay.”

Three years ago, the last time the authority tested for lead, it found three homes with levels above 15 ppb, according to its report.

One theory floated by the authority is that with superstorm Sandy forcing many people out of their homes and not subsequently running their household pipes, the underutilized water supply’s acidity levels may have increased near the ends of the system. The more acidic water would have then been more prone to eat away at the pipes and solder, releasing the lead.

But according to the authority’s website, their testing last month of the system’s water found a pH level of 7.5, which is not considered acidic.

On the Asbury Park Press’ Facebook page, Brick residents lamented the news and wondered aloud whether to buy filters or bottled water to be safe.

Most filters available on the market will not properly exclude lead from the water, said Amy Goldsmith, New Jersey director of Clean Water Action.

“Filters give people a false sense of security,” Goldsmith said. “Most filters don’t really work for lead.”

Boiling the water could actually make the problem worse, Goldsmith said. Heat will not cause lead, a metal, to vaporize or otherwise leave the water inside a kettle or pot, she said.

Boiling will cause some of the water to evaporate, leaving an even more lead-laden liquid, Goldsmith said.

“The best, easiest method is what Brick is advising residents to do, which is to run their pipes in the morning or after any other period when the water in the house has not been used,” Goldsmith said.

Last week, the authority sent a notice of the test results to every resident in Brick. It advised them to run their pipes for at least 30 seconds before usage, and to only consume cold water.

The authority, which had already begun to add a corrosion inhibitor to its water supply, is now expected to test every six months until the problem is remedied, according to the DEP.

Authority officials could not be reached for comment on whether they will consider paying for residents to test their water for lead.

“I don’t think the residents are getting the help that they need here from the town,” Richards said. “They’re just doing the minimum that they have to do.”

Source:  app.com.

Pure Water Gazette Fair Use Statement

Do you know how many toxic chemicals are in your shampoo, your lipstick, your toothpaste?

 by Joy McCarthy


We’ve been using cosmetics and personal-care products for thousands of years, from body paint to eye makeup, in nearly every single culture in the world. Egyptians first started using scented oils and ointments to clean and soften skin. They were also the first to use toxic chemicals in their beauty products, with lead and arsenic being common ingredients.

Fast-forward to today and you’d assume things have gotten better, right?

Not exactly. In 2007, researchers at the California-based Campaign for Safe Cosmetics found what they thought to be “hazardous levels” of lead in one-third of the red lipsticks they tested. And lead isn’t the only issue. There are over 84,000 chemicals registered for use with the U.S. Environmental Protection Agency. (Being registered does not imply safety, only that they are used and tracked in some capacity.) Only 200 of these chemicals have been reviewed by Canada’s Chemicals Management Plan. (Again, these chemicals are not necessarily safe.) We’re still using chemicals we know are toxic, as well as a host of others whose effects are unknown.

While words like “lead” or “arsenic” would certainly raise your eyebrows, it’s not always so easy to discern the harmless from the potentially harmful. Here’s a list of the chemical “usual suspects” to watch out for, according to the David Suzuki Foundation:

• BHA and BHT. These are used as preservatives in moisturizers and makeup. Both are thought to be endocrine disruptors (chemicals that can interfere with hormones) and BHA has been linked to cancer.

• Coal-tar dyes. These are dyes that will have “Cl” followed by a five-digit number on the label (or in the United States, “FD&C” followed by the colour). These dyes are potentially carcinogenic and may be contaminated with toxic heavy metals.

• Siloxanes. Anything that ends in “-siloxane” or “-methicone” falls into this category. These chemicals are used as moisturizers in makeup and hair-care products, but they may also interfere with hormone function and damage your liver.

• DEA, MEA and TEA. These chemicals give moisturizers and shampoos a creamy, foamy texture, but they can also react with other chemicals to form cancer-causing nitrosamines.

• Phthalates. These plasticizer chemicals make personal-care products easier to handle and apply. They’re also suspected endocrine disruptors and reproductive toxins, and definitely not something that should be in cosmetics targeted at women (or anyone, for that matter).

• Formaldehyde-releasing preservatives. Remember that toxic, carcinogenic liquid used to preserve your high-school biology dissection project? It may be lurking in your nail-care products, hair dyes and shampoos under the names formic aldehyde, formalin, DMDM hydantoin, diazolidinyl urea or others.

• Parabens. These preservatives are found in a wide range of beauty products and have been linked to hormone disruption and breast cancer.

• Fragrance (a.k.a. parfum). Even products marked “unscented” may contain fragrance, so check your labels thoroughly. Because fragrances are often considered “trade secrets,” manufacturers aren’t usually required to disclose what chemicals they comprise, but some fragrance chemicals have been linked to cancer and neurotoxicity, while many can trigger asthma and allergies. The best course of action here is to call the manufacturer and see if they will disclose their ingredients.

• PEG. These compounds are used in many cosmetic cream bases, as well as in conditioners and deodorants, and can be contaminated with carcinogenic 1,4-dioxane.

• Petrolatum. Doesn’t that word look an awful lot like “petroleum?” That’s because this is a petroleum product – meaning its very production isn’t great for our environment – usually used for shine and as a moisture barrier in cosmetics and skin-care products. But these petroleum products can also be contaminated with cancer-causing impurities.

• Sodium laureth (or lauryl) sulfate. Also known as SLES and SLS, these two chemicals were initially used as industrial cleaners in car-wash soaps and engine degreasers and now produce the foam associated with a wide variety of personal-care products, including shampoos and bubble baths. SLES and SLS can be irritating to sensitive skin and can be contaminated with carcinogenic 1,4-dioxane.

• Triclosan. This antibacterial compound found in toothpastes, soaps and hand sanitizers may do more harm than good, since it may interfere with hormone function and lead to liver fibrosis, as a new study shows. Plus, it contributes to the creation of superbugs, as bacteria become resistant to its antibiotic properties.

This list may feel a little overwhelming at first and you may be thinking that cosmetics companies wouldn’t put anything unsafe in their products, right? That’s a reasonable conclusion, but unfortunately we must be responsible for what we put on our bodies because many companies are not, in fact, looking out for our health.

Some companies defend their products with the claim that each potential toxin is in such tiny doses that it couldn’t possibly cause harm. However, most people use a variety of products, from body wash to body lotion to perfume to lip gloss, and that’s just first thing in the morning. According to the Campaign for Safe Cosmetics, the average person is exposed to 126 toxic chemicals from personal care alone, per day. What about all these toxic chemicals in combination? The problem is, we just don’t know.

When I personally made the switch to clean beauty products more than 10 years ago along with healthy lifestyle changes, my health transformed for the better, including clearer skin. Not only do I feel good using products with coconut oil as a base but I know that these products are safe for the environment as well. No fish will be bothered by the fact that the main ingredient in my face wash is coconut milk.

Ditching toxic ingredients and replacing them with clean ones in your personal-care products will go a long way to helping your skin glow from the inside out and lessen the burden on your liver, the body’s main organ of detoxification which has to neutralize every itty-bitty chemical that comes into contact with your skin.

Source: The Globe and Mail. 

Pure Water Gazette Fair Use Statement.


Desalination


Posted November 22nd, 2014

Getting Drinking Water from the Sea

by B. Sharper

Pure Water Gazette numerical wizard Bee Sharper rolls out some numbers on production of fresh water by sea water desalination.


Approximate number of desalination plants in the world as of 2013 — 17,200.


Daily production capacity of these plants in gallons — 23 billion.


Percentage of these plants that make potable water from sea water — 59%.


Percentage that make potable water from brackish water — 22%.


Percentage that make potable water from river water and wastewater — 9%.


Total dissolved solids (TDS) count of the saltiest of sea waters (e. g,.the Arabian Gulf) — 50,000 mg/L.


Total dissolved solids (TDS) count of most ocean water — 35,000 mg/L.


Typical chloride content of sea water — 19,000 mg/L.


Typical calcium content of sea water — 400 mg/L.


Typical sodium content of sea water — 10,500 mg/L.


Typical number of viruses present in one drop of sea water — 1,000,000.


Nominal pore size of a reverse osmosis membrane used for desalination — 0.0001 to 0.001 microns.


Nominal pore size of a nanofiltration membrane — 0.001 microns.


Psi equivalent of one bar of pressure — 14.5.


Pressure required to treat sea water by reverse osmosis desalination — 55 to 70 bars (800 psi to 1000 psi).


Pressure required to treat brackish water by reverse osmosis desalination — 15 to 35 bars (220 psi to 500 psi).


Percentage of salts, organics, and microbes that are removed from sea water by high pressure reverse osmosis — 99%+.


Estimated per gallon cost of producing fresh water by desalination with reverse osmosis –1/2 cent.


Desalination plant at Al Khaluf in Oman


Industrial Pollution Is Turning Lakes into “Jelly”

by Rachel Feltman


As Canadian lakes have become more acidic, they’ve become increasingly dominated by jelly-like plankton that are throwing things out of whack, new research suggests. And these gummy invaders aren’t going anywhere. Soon, they could even disrupt the country’s water supply.

Years of industrial pollution have replaced the calcium that should be in Canadian soil with acid. Over time, as the drainage areas that feed the country’s lakes are leeched of their calcium, so are the lakes themselves.

Gummy Invaders are Bad News for Plankton (Click Picture for Larger View)

That’s bad news for the calcium-rich plankton (like the Daphnia water fleas) that used to thrive there. Research published recently in the Proceedings of the Royal Society B suggests that these plankton may be losing their turf to invaders less friendly to human needs.

Daphnia need calcium to build up their exoskeleton. Without it, they’re more vulnerable to predators, and their populations have been dropping. Meanwhile, the researchers report, climate change has caused oxygen levels in the lakes to decline as well. This makes for higher populations of larval midges, which are Daphnia’s main predators.

That’s allowed the opportunistic Holopedium to jump in, and the study authors report that populations of these gelatinous plankton have exploded in the past few decades. They only need a tenth of the calcium that Daphnia do, and are protected by their outer jelly capsules instead of by hard exoskeletons.

According to the researchers, Holopedium have been steadily increasing since around 1850 — around the same time that industrialization began.

Why worry about jelly lakes? The researchers believe that these plankton will continue to increase in number, and will eventually be numerous enough to clog up the extraction of drinking water. They also worry that the plankton will disrupt the food chain, eventually causing changes in the populations of other organisms.

“It may take thousands of years to return to historic lake water calcium concentrations solely from natural weathering of surrounding watersheds,” study co-author Andrew Tanentzap of the University of Cambridge said in a statement. “In the meanwhile, while we’ve stopped acid rain and improved the pH of many of these lakes, we cannot claim complete recovery from acidification. Instead, we may have pushed these lakes into an entirely new ecological state.”

Source: Washington Post.

Pure Water Gazette Fair Use Statement

US Water Use Lowest Since 1970


Posted November 17th, 2014


According to USGS, National Water Use Is at Lowest Levels Since Before 1970:  Conservation Works

Water use across the country reached its lowest recorded level in nearly 45 years. According to a new USGS report, about 355 billion gallons of water per day (BGD) were withdrawn for use in the entire United States during 2010. This represents a 13-percent reduction of water use from 2005 when about 410 BGD were withdrawn and the lowest level since before 1970. “Reaching this 45-year low shows the positive trends in conservation that stem from improvements in water-use technologies and management,” said Mike Connor, Deputy Secretary of the Interior. “Even as the US population continues to grow, people are learning to be more water conscious and do their part to help sustain the limited freshwater resources in the country.”

In 2010, more than 50 percent of the total withdrawals in the US were accounted for by 12 states, in order of withdrawal amounts: California, Texas, Idaho, Florida, Illinois, North Carolina, Arkansas, Colorado, Michigan, New York, Alabama and Ohio. California accounted for 11 percent of the total withdrawals for all categories and 10 percent of total freshwater withdrawals for all categories nationwide. Texas accounted for about seven percent of total withdrawals for all categories, predominantly for thermoelectric power, irrigation and public supply. Florida had the largest saline withdrawals, accounting for 18 percent of the total in the country, mostly saline surface-water withdrawals for thermoelectric power. Oklahoma and Texas accounted for about 70 percent of the total saline groundwater withdrawals in the US, mostly for mining. “Since 1950, the USGS has tracked the national water-use statistics,” said Suzette Kimball, acting USGS Director. “By providing data down to the county level, we are able to ensure that water resource managers across the nation have the information necessary to make strong water-use and conservation decisions.”

Water withdrawn for thermoelectric power was the largest use nationally, with the other leading uses being irrigation, public supply and self-supplied industrial water, respectively. Withdrawals declined in each of these categories. Collectively, all of these uses represented 94 percent of total withdrawals from 2005-2010.

— Thermoelectric power declined 20 percent, the largest percent decline.
— Irrigation withdrawals (all freshwater) declined nine percent.
— Public-supply withdrawals declined five percent.
— Self-supplied industrial withdrawals declined 12 percent.

A number of factors can be attributed to the 20-percent decline in thermoelectric-power withdrawals, including an increase in the number of power plants built or converted since the 1970s that use more efficient cooling-system technologies, declines in withdrawals to protect aquatic habitat and environments, power plant closures and a decline in the use of coal to fuel power plants. “Irrigation withdrawals in the United States continued to decline since 2005, and more croplands were reported as using higher-efficiency irrigation systems in 2010,” said Molly Maupin, USGS hydrologist. “Shifts toward more sprinkler and micro-irrigation systems nationally and declining withdrawals in the West have contributed to a drop in the national average application rate from 2.32 acre-feet per acre in 2005 to 2.07 acre-feet per acre in 2010.”

For the first time, withdrawals for public water supply declined between 2005 and 2010, despite a four-percent increase in the nation’s total population. The number of people served by public-supply systems continued to increase and the public-supply per capita use declined to 89 GPD in 2010 from 100 GPD in 2005. Declines in industrial withdrawals can be attributed to factors such as greater efficiencies in industrial processes, more emphasis on water reuse and recycling, and the 2008 US recession, resulting in lower industrial production in major water-using industries.

In a separate report, USGS estimated thermoelectric-power withdrawals and consumptive use for 2010, based on linked heat- and water-budget models that integrated power plant characteristics, cooling system types and data on heat flows into and out of 1,290 power plants in the US. These data include the first national estimates of consumptive use for thermoelectric power since 1995, and the models offer a new approach for nationally consistent estimates.

Source: WCPonline. 

Pure Water Gazette Fair Use Statement


Turbidity

 Pure Water Gazette Technical Writer Pure Water Annie Clears Up Turbidity


Turbidity can be thought of as the general cloudiness of water. It is actually a measurement of the degree to which particulate in the water interferes with light transmission. Suspended particles absord and diffuse light.

 High turbidity can be identified without a water test.

A turbidity test uses an instrument that passes light through the water and measures the amount of interference from suspended particles.The turbidity test reports results on an artificial scale using nephelometric units, or ntu. Anything above one ntu is technically an EPA “action level” violation, although the human eye only begins to detect turbidity in water at about 4 ntu. Therefore, water that appears completely clear to the eye can have excessive turbidity with health implications.

Turbidity in groundwater is often from tiny mineral particlses. These can include precipitated iron, clay particles or calcium carbonate precipitation.  In surface water turbidity is more likely suspended organic matter or other sediment.

The level of turbidity can, of course, range from invisible to the eye to highly colored water that is not transparent.   

Turbidity in water is more than an aesthetic issue. It is a frequent indicactor of microbial contamination because microbes can attach themselves to suspended sediment. Turbidity also makes it more difficult to disinfect water with chemicals.  The same is true with UV treatment because suspended particles can shadow microbial contaminants protecting them for the germicidal effect of the UV lamp.


Residential sediment treatment can range from the “sand trap” shown above, which relies on gravity to drop large particles from the water, to extremely tight membrane filters that can screen out sub-micron sized particles.

Treatment for turbidity is mainly by filtration. Sediment filters can be cartridge style, granular beds, or membrane-style. With large particles, simply holding the water in a tank will allow particulate to settle out. In municipal treatment, settling and filtration are often aided by chemicals like alum which promote coagulation and flocculation of small particles to form larger particles that settle or are filtered easily. The very tiniest if particles can be treated by membrane technologies like microfiltration, ultrafiltration, nanofiltration, and reverse osmosis.


This “microguard” cartridge filters out particulate (as well as bacteria and cysts) down to a very tight 0.15 micron absolute.  

It is important to realize that turbidity in water is not just an aesthetic consideration. While crystal clear water is certainly more appealing to the eye and to the palate, turbidity is also an important health consideration because microbes thrive in unclean water. Even if water appears clear, it is a good idea to test for turbidity and to take high turbidity readings seriously.


When cloudy water clears from the bottom upward as in the picture, the problem is not physical particulate but simply excess air trapped in the water. This sometimes occurs when carbon filters are new.

Commonly used sediment filters:

Simple wound string, spun polypropylene and pleated cartridge filters. These are available in a large range of “tightness” ratings that are stated in “microns.” Cartridge filters range in size from tiny to very large. Probably the most common residential whole house sediment filter is the popular ten-inch “Big Blue.” 

“Spin down” separators that are usually measured by “mesh” size. These have long lasting screens that are cleaned by simple blow down process.

“Sand traps” that allow large particles to drop from the water into a specially designed filter tank.

Backwashing filters that contain specialty media designed to trap sediment. The newer natural zeolite media can filter down to 5 microns.


Pure Water Gazette Numerical Wizard Bee Sharper Zeroes in on Water News from October 2014

B. Sharper Ferrets Out the Facts that Harper’s Misses

The items below appeared in the Pure Water Occasional during the month of October, 2014.

Number of people worldwide who now lack access to improved sanitation facilities — 2.5 billion.

According to the World Bank, the total percentage of diseases in the developing world that are caused by drinking unsafe water — 88%.

Number of people in southern Africa who lack access to basic latrines — 174,000,000.

Children who die annually in southern Africa from diarrhea caused by unsafe drinking water and poor sanitation — 120,000.

Rank of the US in per capita water use worldwide — 6.

Rank of Australia — 19.

Rank of Turkmenistan — 1.

Percentage of Turkmenistan’s land that has become desert since the 1960s– 70%.

Factor by which a citizen of Turkmenistan uses more water than a US citizen — 4.

Factor by which a citizen of Turkmenistan uses more water than a Chinese citizen — 13.

Rank of agriculture among the reasons why Turkmenistan and other Central Asian countries are the world’s top per capita water consumers — #1.

Amount of water required to produce the energy to power a single 60W incandescent light bulb — 3,000 to 6,300 gallons.

Percentage of total US fresh water that is required to cool thermo electric power generation — 39%.

Per capita monthly k Wh usage of Haiti — 2.

Per capita monthly k Wh usage of Iceland — 4, 172.

Percentage of the water treated by municipalities that is actually consumed by people — 1%.

Percentage that is “working water” (water for toilets, lawns, laundry, etc.) — 99%.

Gallons of irrigation water needed to grow one pound of avocados in the United States — 74.1.

To grow one pound of peaches — 42.1.

To grow one pound of lettuce — 5.5.

US per capita avocado production in 1999 — 1.1 lbs.

US per capita avocado production in 2011 — 4.5 lbs.

Percentage of avocado’s consumed in the United States that are imported — 70%.

Estimated number of pieces of plastic found afloat in every square kilometer of ocean — 13,000.

Depth at which a discarded sewing machine was found in the Mediterranean Sea — 4,000 feet.

Percentage of drought-driven water rate increase this year in Wichita Falls, TX — 53%.

Percentage of rate increases projected each year for the next 5 or 6 years in Dallas — 3% to 5%.

Percentage of rate increase projected for San Antonio water/wastewater rates over the next 5 years — $41%.

Estimated percentage of private wells in New Hampshire that have elevated levels of arsenic — 20%.

Annual water use in gallons of one Fresno, CA city councilman due to lawn irrigation “malfunctions” — 1.24 million.

Year of Dr. John Snow’s famous Broad Street Pump Study — 1854.

Rank of drought and water shortage among this week’s top water stories — #1.

Tons of BPA spewed into the atmosphere in 2013 by US companies — 26.

Gallons of water that could be saved annually by putting an “environmental label” on beef products — 76 to 129 billion.

Brain cancer rate increase among girls in a Florida town whose water was contaminated by the radioactive wastes of a defense contractor – 550%.

Ticket price charged by promoters to see “the most polluted mine in Montana” — $2.

Age of Boyan Slat, who has launched a significant project aimed at ridding the oceans of plastics — 20.

Aging, in years, added by drinking a daily 20-ounce soda, according to an American Journal of Public Health study — 4.6.

Year in which status of the British outpost Rockall was downgraded from island to rock — 1997.

Nautical square miles of ocean lost by the United Kingdom because of the downgrade — 60,000.

Factor by which water well drilling has increased in Santa Barbara, CA during the current drought — 3 times.

Percentage of the UK’s public water that is taken from groundwater sources — 35%.

Cost of restoring the Kissimmee River to its near meandering state after it was “straightened” by the U.S. Army Corps of Engineers — $ 1 billion.

 Tons of London sewage that pollute the Tidal Thames in an average year — 39 million.

Tons of London sewage that polluted the Tidal Thames in 2013 — 55 million.

Years it will take to build the new Thames Tideway Tunnel that will fix the problem — 7.

Estimate number of abandoned mines in the US — 500,000.

Number of these that have been “identified” by the US government — 46,000.

Number of years that mine tailings can leach toxins into water supplies — 100.

Estimated cost to US taxpayers for cleanup of the nation’s abandoned mines — $32 to $72 billion.

Amount that Maryland fines giant agribusiness chicken factories when they submit “incomplete reports” of their activities — $250.

Number of cases of Ebola contracted by drinking water during the current outbreak — 0.

Number of cases of Ebola predicted to be contracted by drinking water during the next decade — 0.

Lost elevation in the water table beneath Stratford, California during the last two years — 100 feet.

Number of times the manure produced in a year on Maryland’s farms would fill Ravens stadium — 2.

Year in which Congress exempted fracking from the requirements of the Safe Drinking Water Act — 2005.

Number of customer water shutoffs made in Detroit between January and September of 2014 — 27,000.

The EPA allowable for benzene in drinking water — 0.005 mg/L  (5 parts per billion).

Current price of Pure Water Products Model 77 Countertop Filter, “the world’s greatest $77 water filter” — $77.

Price of Model 77 in 1992, 1996, 1999, 2004, and 2013 — $77.