Water News, September 2023


Posted September 30th, 2023

Water News for September 2023


newsboy


Can the Great Salt Lake Be Saved?

Environmental and community groups have sued Utah officials over failures to save its iconic Great Salt Lake from irreversible collapse. The largest saltwater lake in the western hemisphere has been steadily shrinking, as more and more water has been diverted away from the lake to irrigate farmland, feed industry and water lawns.

A megadrought across the US southwest, accelerated by global heating, has hastened the lake’s demise. Unless immediate action is taken, the lake could decline beyond recognition within five years, a report published early this year warned, exposing a dusty lake bed laced with arsenic, mercury, lead and other toxic substances. The resulting toxic dust bowl would be “one of the worst environmental disasters in modern US history,” the ecologist Ben Abbott of Brigham Young University said earlier this year.

Despite such warnings, officials have failed to act, local groups said in their lawsuit. “We are trying to avert disaster. We are trying to force the hand of state government to take serious action,” said Brian Moench of the Utah Physicians for a Healthy Environment, one of the groups suing state agencies.

Can the lake be saved? Despite growing political momentum on the issue, scientists say the proposed measures are not nearly enough to save the lake, which has lost about 40 billion gallons of water annually since  2020.  The Guardian

Five American cities are one intense climate issue away from being in serious trouble.

CNN in an in depth report listed five American cities –Buffalo, New York; Prichard, Alabama; St. Louis, Missouri; Central Coast, California; and San Juan, Puerto Rico as all facing existential vulnerabilities that could leave drinking water or wastewater systems in total disrepair should climate-induced calamity strike. And these potential worst-case scenarios range from drinking water scarcity to stormwater inundation.   Water Online.

In September,  Antarctic sea ice shrank to the lowest level ever recorded.  Full story from The Guardian.
 

Salt Intrusion in Louisiana

The very low water level of the Mississippi is allowing Gulf water to seep into drinking water sources in parts of Louisiana. As a result, grocery stores are struggling to keep up with bottled water sales.Residents have reported skin irritations and damaged appliances, including water heaters and washing machines, from salt exposure.  “Unimpeded salt water continues to creep upriver and threatens municipal drinking water. That makes it unsafe to drink — especially for people with kidney disease, high blood pressure, people on a low-sodium diet, infants and pregnant women.” U.S. News.   New Orleans Mayor LaToya Cantrell has signed an emergency declaration over an intrusion of saltwater into the Mississippi River that officials say could impact the water supply in the region.

The Carbon Footprint of Pet Fish


goldfish0930

A lot has been written about the environmental impact of owning pets like dogs and cats, but not a lot has been said about the carbon footprint of pet fish ownership.  As you might guess, there’s a world of difference between owning a goldfish and maintaining a full-fledged aquarium for tropical fish. What’s the carbon footprint of owning pet fish?  looks at the environmental consequences like water and energy use of maintaining an aquarium in some detail. Environmental concerns related to fish ownership are mainly water used, which can be considerable for large aquariums requiring reverse osmosis water and frequent water changes, and energy used for pumping and heating water.  The Conversation.


A recent poll reported by Greenwire found that 79% of voters want more water infrastructure funding.


Study Finds Disparities in Public Water Quality Associated with Race and Income

Recent studies funded by the Superfund Research Program (SRP) reached the not-surprising conclusion that socioeconomic factors, such as race and income, may be associated with disparities in exposure to drinking water contaminants. For their studies, researchers evaluated contaminants in private wells and community water systems in various regions across the country. 

These disparities stem from a long history of unequal environmental protections and investments in water infrastructure. As a result, water is more likely to become contaminated in poor communities and these communities face greater technical and financial challenges in maintaining water quality that meets safety standards.Environmental Factor


The Advantages of Parallel Installation of Backwashing Water Filters


bwparallel02crop


The illustration shows two carbon backwashing filters installed in parallel so that each filter gets half of the treatment stream.

We have long been advocates of parallel installation of two or more cartridge-style filters to achieve higher service flow, to lengthen cartridge life, and to improve overall effectiveness of the filters.  Parallel installation also works well with larger backwashing filters.

The challenge in sizing backwashing filters for residential applications is that the filter must be large enough to support sufficient service flow to the home but small enough to fit the space available and to be regenerated on the amount of water available.  With filters for challenging contaminants like iron and manganese, the filter often needs more gallons per minute to regenerate itself than it is capable of treating.  For example, a well that puts out only six gallons per minute usually cannot support an iron filter that will treat six gallons per minute because backwashing the filter requires more than six gallons per minute.  Challenges like this can often be overcome by installing two small filters side by side rather than a single larger filter.

Parallel installation means splitting the water line in half so that each of two filters handles only half of the service flow to the home, then bringing the two lines of treated water together. In the system illustrated above, the carbon filters each get half of the water stream at half the flow rate. If the treatment stream is flowing at five gallons per minute, each filter has to process only 2.5 gallons per minute. The filters then backwash separately so that each gets the full water stream that the well is capable of.

Here are some common situations where two side-by-side filters work better than a single larger filter.

Space limitations. — In a basement or crawl space with limited height, where a 52″ tall filter holding two cubic feet of media won’t quite fit, you can use two 48″ filters each holding one cubic foot. 

Water limitations. If the water source won’t put out enough water to backwash the iron filter you need, you can use two smaller filters and set them up to backwash at different times. Each filter has to process only half of the service flow but gets the well’s full output for backwash. (It is common for a backwashing filter to need a higher flow rate for backwash than it is capable of processing for service flow.)

Ease of upkeep. A single large backwashing filter can be too heavy for installation or for a media change without power equipment or special tools, but a single individual can often manage a smaller tank that has half the media and water of the larger tank.

Simplicity of equipment. Using two smaller filters rather than one very large one usually allows use of a more user-friendly small residential control valve rather than a large commercial assembly that is harder to service, harder to find parts for, and more complicated to program. Likewise, two smaller residential control valves are in many cases less expensive than a single commercial-sized control.

Redundancy. If a filter malfunctions and needs repair, you can bypass the faulty unit and still have water service to the residence through the remaining unit. You may have to limit your water consumption, but it’s sure better than having no water at all.

Here are some tank size equivalents, based on media needed.

A 1o” x 54″ filter can be replaced by two  8″ X 44″ filters to make a 1.5 cubic foot filter.

A 12″ x 52″ filter can be replaced by two 9″ X 48″ filters to make a 2.0 cubic foot filter.

A 13″ x 54″ filter can be replaced by two 10″ X 44″ filters to make a 2.5 cubic foot filter.

Larger units.

Two 12″ X 52″ filters can replace a 14″ X 65″ or a 16″ X 65″.

Two 13″ X 54″ units and replace a 18″ X 65″ filter.

Three 13″ X 65″ filters can substitute for a 21″ X 62″ filter.

There are, of course, many other possibilities.


The myths we tell ourselves about American farming

“Agricultural exceptionalism,” explained.

by Kenny Torrella

hogpond

“These factory farms operate like sewerless cities.”

If you were to guess America’s biggest source of water pollution, chemical factories or oil refineries might come to mind. But it’s actually farms — especially those raising cows, pigs, and chickens.

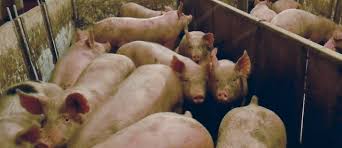
The billions of animals farmed each year in the US for food generate nearly 2.5 billion pounds of waste every day — around twice as much as people do — yet none of it is treated like human waste. It’s either stored in giant pits, piled high as enormous mounds on farms, or spread onto crop fields as fertilizer. And a lot of it washes away into rivers and streams, as does synthetic fertilizer from the farms growing corn and soy to feed all those animals.

“These factory farms operate like sewerless cities,” said Tarah Heinzen, legal director of environmental nonprofit Food and Water Watch. Animal waste is “running off into waterways, it’s leaching into people’s drinking water, it’s harming wildlife, and threatening public health.”

Yet in practice, the Environmental Protection Agency appears to be largely fine with all that.  


When Congress passed the Clean Water Act in 1972, it explicitly directed the EPA to regulate water pollution from “concentrated animal feeding operations,” or factory farms, among other businesses. But according to Food and Water Watch, fewer than one-third of the largest factory farms are actually regulated — and lightly, at that.

Earlier this month, the EPA told Food and Water Watch it’s going to stay that way. The EPA rejected a 2017 joint petition from the group and other environmental organizations, calling on the agency to better regulate factory farms under the Clean Water Act.

The kind of regulatory evasion that allows for so much water pollution is just the latest example of what food industry reformers call “agricultural exceptionalism,” which lets the sector operate under a different set of rules than other parts of the economy, leading to widespread abuse in the food system. It’s fueled by romanticized myths about farming that mask the original sins of American agriculture — most notably slavery and mass land expropriation from American Indians — and the modern-day issues of mass pollution, animal cruelty, and labor exploitation. And it’s come to affect virtually every part of how food gets from the farm to your table.

Rather than regulate more factory farms for pollution, the EPA said in its recent decision that it will set up a committee next year to further study the issue for 12 to 18 months. The agency denied an interview request for this story, but a spokesperson said in an email that “a comprehensive evaluation is essential before determining whether any regulatory revisions are necessary or appropriate.”

The National Pork Producers Council celebrated the news, saying in a statement, “We are grateful for the Biden administration’s continuous commitment and support of agriculture.”

Silvia Secchi, a natural resource economist at the University of Iowa, said the EPA’s plans for a lengthy evaluation amount to little more than a stall tactic. “We’ve been studying some of this stuff for decades,” she said. “We already know what needs to be done.”

We’ve also been here before, she added, pointing to another landmark piece of environmental legislation: the Clean Air Act. In 2005, after years of industry noncompliance with the law, the EPA under Republican President George W. Bush brokered a deal in secret with the pork industry, promising to hold off on regulating factory farms so long as they funded research into the issue. Nearly two decades later, no regulatory action has been taken. In the last five years, Congress and the EPA have exempted farms from two other critical air quality laws, despite more deaths linked to air pollution from factory farms than pollution from coal power plants.t’s the tactic of the [agricultural] industry to slow walk everything — renegotiate, restudy, reevaluate the obvious,” Secchi said.

Agricultural exceptionalism, explained

To understand why agriculture so often gets a free pass on commonsense regulation, we have to go back to the early 1900s. Back then, most workers across industries toiled for six days a week and often well over eight hours a day, including millions of children. President Franklin Roosevelt campaigned on shorter hours and higher pay, and in 1938, he signed the Fair Labor Standards Act into law as part of the New Deal. It set rules for minimum wage, overtime pay, maximum workweeks, restrictions on child labor, and more.

Time called it “the law that changed the American workplace,” and it did — except on farms.

“To obtain sufficient support for these reforms, President Roosevelt and his allies had to compromise with Southern congressmen,” Alexis Guild of the nonprofit Farmworker Justice wrote in a 2019 paper with her former colleague Iris Figueroa. “These compromises included exclusions of farmworkers and domestic workers from the law’s protections, preserving the plantation system in the South — a system that rested on the subjugation of racial minorities.”

The carveouts for agriculture in labor law set the tone for how farming would be regulated — or unregulated — for decades to come.  

On top of exemptions from critical environmental and labor legislation, farms are also exempt from the Animal Welfare Act, leaving billions of animals raised for meat, eggs, and dairy — almost all of whom are raised in terrible conditions on factory farms — with virtually no federal protections. The federal law that’s meant to reduce animal suffering at slaughterhouses exempts chickens and turkeys, which make up 98 percent of land animals raised for food.

The United States Department of Agriculture, the agency charged with the paradoxical task of both regulating and promoting agriculture, hasn’t been shy about its deference to industry. When asked in an interview on the Climavores podcast why farms aren’t regulated to reduce pollution, USDA Secretary Tom Vilsack said there are simply too many farms to regulate, and that conservation efforts should be voluntary — and farms should be compensated for them (they are, handsomely, with taxpayer dollars, while municipalities spend billions annually to clean up farm pollution).

It’s not just the USDA and the EPA that often look the other way when problems arise in our food system. Netflix’s new hit documentary Poisoned details how the USDA and the Food and Drug Administration’s lax food safety regulations lead to over a million consumers sickened annually, largely from tainted chicken and leafy greens contaminated by livestock manure.

According to Civil Eats, a nonprofit publication covering the US food system, nearly all animal agriculture operations are exempt from federal protections under the Occupational Safety and Health Administration, and the agency doesn’t respond to 85 percent of worker fatalities on animal farms.

US immigration law ensures the agricultural sector has a steady supply of largely foreign-born, low-paid, and exploited — sometimes even enslaved — workers. Meanwhile, the federal government gives ranchers 155 million acres of public land for cattle grazing at practically no cost.

Agricultural exceptionalism trickles down to the state level, too. Most states exempt livestock from anti-cruelty laws, and many states have passed “ag-gag laws,” which criminalize activists and journalists for simply recording what goes on at farms. Most state environmental agencies — including in progressive states like Californiadon’t do much to regulate farm pollution.


All 50 states have so-called “right to farm” laws, which prevent citizens from suing farms for nuisances like pollution and odor that degrade their quality of life. “The smell, you can’t hang your clothes out, you can’t do nothing in the yard,” said one North Carolina woman who lives a few hundred feet from a pig waste storage pit.

One corn and soybean farmer in Nebraska who lives near giant chicken farms described the stench of manure and pits of decomposing birds as “the death smell” that “tries to get inside anything it can.”

How taxpayers enrich agribusiness

While the entire food sector benefits from agricultural exceptionalism, animal agriculture is especially privileged. Meat and dairy producers get far more subsidies than farmers growing more sustainable foods, like beans, vegetables, fruits, and whole grains.

A recent analysis from Stanford University researchers found that livestock farmers receive 800 times more public funding than non-animal farmers. “It’s clear that powerful vested interests have exerted political influence to maintain the animal-farming system status quo,” Eric Lambin, one of the study authors, said in a press release.

This dates back much further than today’s industrialized, corporate-dominated food system. As Secchi notes, Congress passed the Homestead Act in 1862, which handed over swathes of the Western US — after taking it from American Indians by land seizures and genocide — to white settlers to farm the land, especially cattle ranchers. Ever since, federal dollars have freely flowed to the agricultural industry, in the form of crop insurance, direct payments, infrastructure and conservation programs, and R&D, further entrenching an industry that has now worked its way into power at every level of government, making reforms near-impossible.

Farmers are heavily overrepresented in government, with 25 current members of the US House of Representatives, or their family members, having collected millions of dollars in agricultural subsidies. That’s almost 6 percent of the chamber, even though just about 1 percent of Americans live on farms. The dynamic is the same at the state level.

Local and state tax codes give special treatment to farmers, taxing farmland at a lower rate than other kinds of land.

Like so many other sectors of the economy, there’s a revolving door between government and business. Vilsack served as President Barack Obama’s agriculture secretary for eight years before heading over to the US Dairy Export Council, where he served as CEO for a few years; in 2021, he returned to government, taking up his old post as agriculture secretary under President Joe Biden. In between, agricultural businessman Sonny Perdue served as President Trump’s agriculture secretary. State agriculture secretaries, from Texas to Nebraska to North Carolina, are often farm owners as well. Nebraska Gov. Jim Pillen is a hog tycoon who’s been accused of air and water pollution since the 1990s, and has used the bully pulpit to attack plant-based meat alternatives.

Big Ag often argues its exceptional status is justified because farming is indeed exceptional, given the essential nature of its product: food. But Secchi argues this is the wrong way of thinking about it. Since the early days of American agriculture, farming has been a business like any other, focused on high output, which has led to excess supply and profitable exports around the world.

And we don’t apply exceptionalist logic to any other industry. Energy production, for example, is highly polluting but essential to human flourishing, just like food, so we push to make our laws and economy limit the industry’s externalities and scale renewable forms of energy.

Exemptions are granted to the agricultural industry not because we’ve ever really been at risk of famine, but because of the powerful myths we tell ourselves about farming.

Breaking out of agricultural exceptionalism

There are fewer political messages as potent, or as bipartisan, as supporting farmers.

“In politics, marketing, even literature and art, the presence of a farm or farmer signals authenticity, sincerity, patriotism, and a ‘real American’-ness that no other occupational group or industry can claim,” wrote Sarah Mock, agriculture writer and author of Farm (and Other F Words), in the Counter. “The problem with this myth, of course, is that it’s a myth.”

It harkens back to the Jeffersonian ideal of the US as “a nation of small farmer-landowners, each economically and politically independent,” making agriculture “the heart and soul of American democracy,” according to a paper by William & Mary Law School professor Linda A. Malone.

However, Jefferson’s vision never came to pass. Small farms have been squeezed out by big farms, due in part to American farm policy advocated for by the same elected officials who evoke the Jeffersonian ideal.

What’s left is a highly consolidated agricultural sector, with many farmers precariously employed as contractors for corporations, and a radically uneven distribution of farm wealth: 98 percent of US farmland is white-owned, and the median commercial farm household had $3 million in wealth in 2021, mostly in land and equipment, compared to the US median of $121,700.One-fifth of America’s 2 million farms don’t even sell food, serving more as real estate investments.


Agricultural exceptionalism cuts across both major political parties, according to food policy expert Nathan Rosenberg and journalist Bryce Wilson Stucki. “While conservatives have consistently pushed more aggressive, pro-agribusiness policies,” they write, “liberals have often responded with pro-agribusiness policies of their own, even when that meant undermining their own natural allies: small and mid-sized farmers, farm workers, rural minority populations, and the small, independent businesses they support.”

Journalists, and even most environmental advocacy organizations, often reinforce agricultural exceptionalism, too.

As a result, according to Secchi, criticizing the modern agricultural system can be politically marginalizing. “In America today, rural and farm are not the same thing, but they tend to be conflated with each other,” she said. “And so they say, ‘Oh, you’re against this, you’re against rural people.’ But it’s not true. Rural people are the first ones to suffer from the pollution, from the poor labor laws, from all the problems that this kind of agricultural system creates.”

The myth of the small, humble family farm, paired with the political clout of millionaire farmers and the lobbying might of the trade associations that represent them, explains why it’s been so hard to reform the food system.

Secchi argues that agricultural exceptionalism persists in part because we haven’t yet reckoned with the ugly roots of American agriculture: slave labor and land expropriation.

If you really want to go after the really core problems, you have to think about the fact that all this land is in private hands that maybe shouldn’t be in private hands,” Secchi said. “And all this unfettered pollution, [farmers] not paying the social costs, particularly of livestock production, requires you to think, ‘What is the alternative model?’ And the alternative model is a model in which we eat a lot less meat.” (Raising livestock requires far more land and water than growing plant-based foods — and produces far more pollution.)

To get there, she said, farmland owners need to be taxed at a higher ate, and we need to do away with the American notion that people can do whatever they want on their private property: “What this change requires is limiting the ability of people who own land to create problems for the rest of us, in terms of the pollution they generate, the water they use … the way they treat their workers, the way they treat their neighbors — they can’t just pass on all these costs to the rest of us.”

A hog waste pond is seen adjacent to hog houses at a farm owned by Smithfield Foods in Farmville, North Carolina. Gerry Broome/AP

I was reminded of the tight grip Big Ag holds on the government during a recent trip to North Carolina, which has a notorious hog pollution problem. On a Sunday morning, I visited Raleigh’s sprawling weekend flea market on the state’s fairgrounds, which are owned and operated by the state’s agricultural department. There’s a giant banner hanging on one of the fairground buildings bearing a simple slogan that makes it clear where the state stands on farm regulation: “TRUST FARMERS.”

Farmers, of course, shouldn’t be distrusted, though farming ought to be held to the same regulatory standards as any other profit-seeking endeavor — perhaps even higher standards, considering the far-reaching effects of its operations. That might give way to a more humane, sustainable food system, in which there are serious costs to pay for polluting waterways, poisoning the air, underpaying workers, and abusing animals — as there should be.

Reprinted from VOX.


Pure Water Gazette Fair Use Statement


Water News — August 2023


Posted August 30th, 2023

Water News — August 2023


Latest news! Retro Vintage Paper boy shouting with megaphone selling newspaper vendor, Extra! Special edition!


The leading water news stories of August focused on three central themes:   the alarming increase in water temperatures of oceans, the release into the ocean of contaminated cooling water from Japan’s failed Fukushima nuclear power plant, and the shockingly high levels of PFAS being reported in the nation’s water supply.
Soaring Sea Water Temperatures
There were frequenltly recorded water temperatures so high they are putting many sea creatures at risk. Scientists are worried that an El Niño–prolonged ocean heat-up off the coast of England and Ireland will result in massive death tolls for sea life, along with other terrible outcomes. That’s because temperatures in the North Sea are already 5 degrees above normalAs conditions mount for continued ocean warming,  experts fear that sea life could be killed off like forest dwellers are destroyed during wildfires. More from the Guardian.

Toxic “forever chemicals” in water systems around the nation. 


Here are some highlights from an article from  The Hill.

Toxic “forever chemicals” have contaminated water systems around the nation, the Environmental Protection Agency (EPA) announced.

Those chemicals could affect the drinking water of 26 million people, an environmental advocacy organization called the Environmental Working Group estimated based on the new EPA data.

Cities where high levels of some of the most toxic types of the chemicals were found include Fresno, Calif., and Dallas, Texas.

The EPA said that two of the most dangerous types of forever chemicals, known as PFOA and PFOS, were found at unsafe levels in between 7.8 and 8.5 percent of public water systems.

An official at the  Environmental Working Group told The Hill he was “gobsmacked” by the results and said,  “Millions of people have been drinking dangerously high levels of PFAS all of their lives and are learning about it today.”

PFAS are a group of toxic chemicals that have become pervasive in both U.S. water and in people. They have been used to make a variety of waterproof and nonstick products including Teflon pans, cosmetics, raincoats and stain removers.

Earlier this year, the EPA proposed regulating PFOA and PFOS, saying it would limit them to just 4 parts per trillion — but the new data shows that even some water systems serving big cities have levels of the chemicals that are higher than this.

A sample from Fresno, for example, saw 16 parts per trillion of PFOA and 29 parts per trillion of PFOS — 4 and 7.25 times the proposed regulatory level from the EPA.

Exposure to PFAS has been linked to illnesses including kidney and testicular cancer, thyroid disease and high cholesterol. They are sometimes referred to as “forever chemicals” because they build up and accumulate in a person’s body over time instead of breaking down.

A sample from Dallas also showed PFOA and PFOS above the EPA’s levels, at 4.7 parts per trillion and 5.1 parts per trillion respectively, while the Dallas sample had a total PFAS  concentration of 53.4 parts per trillion.

The findings add to a body of literature indicating that these chemicals are widespread. A July assessment from the U.S. Geological Survey found that PFAS were in 45 percent of U.S. taps.

For PFAS overall, which is a broad class of thousands of chemicals, Fresno had 194.3 parts per trillion.

Release of water from Fukushima

The long-anticipated and very controversial release into the ocean of contaminated cooling water from Japan’s failed Fukushima nuclear power plant has begun. The main issue from a water quality perspective is the discharge of tritium, which cannot be removed by treatment before the water is released. There is significant disagreement about the impact of tritium on water quality. See the Guardian for a full discussion. 

Other Water News

“Google just published its 2023 environmental report, and one thing is for certain: The company’s water use is soaring,” Business Insider reported. “The internet giant said it consumed 5.6 billion gallons of water in 2023.  And as Google and every other tech company in the AI arms race speed to build new data centers, the amount of water they consume will very likely keep rising.” Water Online.
127-year-old water main breaks

A 127-year-old water main under New York’s Times Square gave way on Aug. 29, flooding midtown streets and the city’s busiest subway station.

The 20-inch (half-meter) pipe gave way under 40th Street and Seventh Avenue at 3 a.m., and quickly delivered a wet reminder of the perils of aging infrastructure beneath the city’s crowded streets.

The rushing water was only a few inches deep on the street, but videos posted on social media showed the flood cascading into the Times Square subway station down stairwells and through ventilation grates. The water turned the trenches that carry the subway tracks into mini rivers and soaked train platforms.

New York City has about 6,800 miles (10,900 kilometers) worth of water mains — enough pipe to stretch from Times Square to Tokyo — and has spent $1.9 billion in the past three years upgrading outdated water and sewer lines. Breaks happen somewhere in the city almost every day, though the city said the 402 water main breaks last year were the second lowest number on record, and better than average for a U.S. city if the size of the system is taken into account.  AP.


New 4.5″ X 20″ Cartridges

The MatriKX PB1 and Chloraguard Carbon Blocks

 chloraguard04MatriKX Chloraguard extruded carbon block filter, for removal of chloramine, chlorine, PFAS, VOCs, and chemicals in general. Made with coconut shell catalytic carbon. Nominal 1 micron filtration.
 
We’re happy to announce that we have added two major MatriKX Coconut Shell Carbon Block cartridges to our 4.5″ X 20″ cartridge offerings.  These cartridges, the PB1 and Chloraguard, fit our popular “Compact Whole House” filter series and they will fit any filter housing that accepts 4.5″ X 20″ cartridges.Both are high quality coconut shell carbon block filters. The PB1 targets lead and cyst removal and the Chloraguard is built to be especially effective at reducing chloramines in city water. Both also are tested and recommended for treatment of VOCs and PFAS.

PB1

The PB1 is a larger version of MatriKX’s popular lead removal cartridge that we’ve used for many years in our drinking water filters. We now stock it in all four popular standard sizes– 2.5 X 9.75, 2.5 X 20, 4.5 X 9.75, and 4.5 X 20.  The 4.5 X 20 version is rated for chlorine, chloramine, PFAS, and VOC reduction, as well as for Lead and Cyst Reduction. A word of caution for whole house filter users.  This is the most restrictive carbon block we offer. The manufacturer rates it at 14 psi pressure drop at 7 gpm. This is double the pressure drop of other MatriKX cartridges in this size.
  • Here are the basics for the PB1.


  • Lead: 25,000 @ 5 gpm,
  • Chlorine:240,000 @ 7 gpm,
  • Chloramine: 12,000 @ 3 gpm,
  • PFAS: 18,000 @ 3 gpm,
  • VOC: 3,000 @ 2 gpm

Chloraguard

 
The Chloraguard uses coconut shell catalytic carbon and is specialized for chloramine reduction. It is also tested and rated by the manufacturer for VOC, PFAS, and a whopping 360,000 gallons of chlorine reduction. Pressure drop is only 7 psi at 7 gpm. 
 
Manufacturer’s specific on the Chloraguard:
 
  • Chlorine: 360,000 @ 7 gpm,
  • Chloramine: 21,000 @ 3 gpm,
  • PFAS: 21,000 @ 3 gpm,
  • VOC: 4,500 @ 2 gpm,


You can get much more information about these cartridges from our website.  Note that at the bottom of our web pages there are links to the manufacturer’s spec sheets. 


Water softeners, a hard problem

by Shawn O. Novack

Introductory Note: The article below, from a San Benito CA news source,  is reprinted because it looks at the ever popular water softener from the viewpoint of both the user and the water supplier. For the water supplier, and for all of us as citizens of the world, the byproduct of the conventional water softener, sodium, has become “the biggest contaminant affecting water supplies in California, the nation and the world.”  Not mentioned in the article are the vendors of water softeners, us, who are addicted to water softeners as a reliable and fairly easy source of income. We acknowledge that we share in the guilt for polluting the world’s fresh water with salt. –Pure Water Products. 

Water softeners reduce the “hardness” of the water in your household, which can have several benefits for consumers. Less soap and detergents are needed for laundry and cleaning. There is less staining, spotting and scaling on appliances. Clothes last longer and there are energy savings in water heating due to less scaling.

But the use of water softeners can also have harmful effects on the environment. Additional salts into our wastewater make it difficult for treatment plants to meet regulatory requirements. Harmful salts also add to the salinity of our groundwater basin.

How does a water softener work?
A typical water softener utilizes an ion exchange, which involves the exchange of the hardness minerals, chiefly calcium and magnesium, for sodium (salt) or potassium (potassium chloride).

The exchange takes place by passing water that contains hardness minerals over ion exchange resins in a tank.

The calcium and magnesium contact the resin as they travel through the resin tank, displacing sodium or potassium ions. The displaced sodium or potassium ions pass downward through the resin “bed” and out the softener drain and into the sewer system. This is how the softener delivers “soft” water, but it also delivers salty brine to our wastewater treatment plant. This is where the problem begins.

The Problem

Every wastewater treatment facility in California must meet strict limits issued by state and federal agencies on the amount of total dissolved solids (TDS) and mineral concentrations to protect groundwater. If a wastewater treatment facility is found to be in violation of its discharge limits by these agencies, significant fines may result.

The discharge of salt brines into the wastewater collection system from the use of water softeners has a negative impact on recycled water and wastewater effluent. Higher salinity increases the treatment costs and reduces the potential for beneficial reuse of wastewater for irrigation of high-value crops and landscaping, and industrial purposes.

It can also impair a wastewater treatment agency’s ability to comply with discharge standards for TDS.

Sodium has little redeeming value in the environment—outside of saltwater or brackish water ecosystems. It has been cited as the biggest contaminant affecting water supplies in California, the nation and the world.

To compound the problem, the local groundwater basin has naturally occurring salt and minerals.

Plus, our groundwater basin is essentially a “closed loop” basin. This means water rarely leaves our basin unless there is a large storm event that swells the San Benito River to where it can push water through to the Pajaro River. This was the case during this year’s storms.

Because of this configuration, in dry and average rainfall years water is allowed to percolate back down into our aquifers and adds mineral content to the groundwater supply.

Solution

The City of Hollister, Sunnyslope County Water District and the San Benito County Water District collaborated on the Hollister Urban Area Water Project that allowed more surface water to be treated locally. The West Hills Water Treatment Plant and the Lessalt Water Treatment Plant process surface water brought into our county from the Central Valley Project. This water has much less mineral content than local groundwater.

Several benefits result from treating more surface water and blending it with groundwater. The City of Hollister and the Sunnyslope County Water District have been delivering higher-quality drinking water to all their customers than in years past. It is still not “soft” but has much less minerals than pure groundwater.

This has increased the quality of wastewater that is treated at the local reclamation plants. Higher quality wastewater assists in meeting discharge requirements, helps to protect the groundwater basin and helps to produce high-quality recycled water that can be used again.

These are the reasons why new installations of water softeners that use salt and/or potassium have been banned in the service areas of the two urban water providers (Sunnyslope County Water District and City of Hollister).

Solving the salinity problem in our water supply will require a community-wide effort.

If you currently own a water softener, the Water Resources Association of San Benito County (WRASBC) has a free service where they will assist you in adjusting your water softener for maximum efficiency. They also offer a rebate program for those customers who would like to demolish their water softeners or transition to a salt-free water conditioner. The rebate for demolishing your old water softener is $300.

Another option, if you truly have a need for soft water, is to transition to an off-site regeneration service where a service provider picks up the salty brine leftover from the regeneration of your softener and processes it outside our county. If you choose this option, a one-year service contract is required, and the rebate is $250.

Just make sure a WRASBC technician inspects your old water softener before disposing of it so you can take advantage of the rebate.

To make an appointment call 831.637.4378.

Shawn O. Novack is Water Conservation Programs Manager for the Water Resources Association of San Benito County, and the San Benito County Water District.

Article Source:  SanBenito.com

Siliphos, Adios


Posted July 30th, 2023

Pure Water Products No Longer Sells Siliphos Spheres

by Gene Franks

We hate dropping a product when we have customers depending on it, but we’re no longer selling Siliphos spheres. I like the product a lot (I use it in my own home) but it’s one of a few products that we’re setting aside so that we can give better service on our core products.

This leaves a few customers (including me) looking for a place to buy replacement spheres. Fortunately, there are now lots internet sources. Just search for “siliphos spheres.” Here’s a picture of what you’re looking for.

Siliphos

What you need to know about the product is that it dissolves into the water very slowly. It doesn’t need to be discarded and replaced; it just needs to be replaced when the container is empty. We estimated once a year replishment on the  three unit sizes that we were offering, but that was a round-number guess and differing conditions require different refill intervals.

Buying siliphos, you need to know that a pound is about 50 spheres. Here’s a chart showing the standard units that we’ve sold with the approximate number of spheres needed for each.


Basic Stand-Alone Siliphos Units from Pure Water Products

Unit Description Home Size Cartridge Size 
Compact Unit with Clear Housing. Installs on 3/4″ pipe. Cartridge holds 100 siliphos spheres (a couple of pounds). One or two people. 9.75″ X 2.5″
Standard Unit with Blue Housing, for 3/4″ or 1″ Pipe.  Cartridge holds 200 siliphos spheres (about 4 pounds). Two to Six People 9.75″ X 4.5″
Large Unit with Blue Housing for 1″ or 1.5″ Pipe. Cartridge holds 250 siliphos spheres (around 5 pounds). Six people or more 20″ X 4.5″

All units have refillable cartridges. Just screw the bottom off of the cartridge and pour in new spheres.   We have replacements for any part on the unit, including the cartridge shells, and we have complete customer records, so call if  you’re unsure  about how much siliphos you need.  888 382 3814.

A few of our customers add a few spheres to the center core of carbon block filters. The end plugs for the cartridges are reusable, but if you need replacements we can supply them until our current stock is gone.


Compact Whole House Filters for a Variety of Purposes

By far the most common application for cartridge-style whole house filtration units is removal of sediment from city and well water  and the removal of chlorine or chloramine from treated city water. However, these very versatile filters can fulfill a number of functions according to the cartridge installed. wh101_306

The compact whole house units use basic standard sized and readily available 4.5″ X 20″ filter cartridges. The housings are the old faithful 20″ Pentek “Big Blue” units, so replacement o rings and wrenches are easy to find. Brackets are sturdy but light stainless steel, and mounting screws are included.  Standard size is for 1″ pipe, but you can have 3/4″ or 1.5″ for the asking.  Two or more units can be joined together with standard hardware store pipe nipples or stainless connectors to make multi-stage filters.

The standard units offered on our website are a 5 micron wound string sediment ($159) and a utility grade CTO coconut shell carbon block filter, a taste/odor/chlorine filter for city water with chlorine.  This unit is often also used to polish taste and odor on well water. ($189.)

 One each of the filters above to be installed in series is a popular combination and costs $329, shipping included.

In addition to the two standard units, the same housing assembly can be used for other filtration tasks.   It becomes a very high performance chemical filter for a variety of contaminants when used with the MatriKX CTO Plus. The CTO Plus version is rated for an incredible 240,000 gallons of chlorine reduction, 12,000 gallons of chloramine treatment, plus reduction of smaller amounts of PFAS and VOC.   Unit price of the unit with the CTO Plus is $210.

It can also be equipped with Pentek’s Radial Flow Chloramine filter.  This very very free-flowing chloramine cartridge is rated for 25,000 gallons chloramine reduction at 2.5 gpm and 200,000 gallons of chlorine reduction at 4 gpm.  Full price is $303.

With Pentek’s 4.5″ X 20″ iron reduction cartridge, the compact whole house unit becomes an exceptionally useful light duty iron filter for well water.  Cost of the compact iron unit is $250.

Other options include pleated, wound string, and melt blown sediment cartridges in many micron ratings, a variety of carbon blocks, plus media cartridges with catalytic carbon, KDF, softener resin, calcite, and more.   Any cartridge on this page will fit the unit, and you can make an approximate price for the full unit by adding $120 to the cartridge price.

Residential Use of Hydrogen Peroxide for Treating Iron and Hydrogen Sulfide


by Scott Crawford

Two common problems found in well water are iron and sulfur. Iron (Fe+2) can discolor the water, spot laundry and stain plumbing fixtures. In addition, the growth of iron-related bacteria sometimes present with iron can result in abnormal taste and odor and contributes to biofouling in plumbing systems.

Hydrogen sulfide (H2S) is characterized by a rotten-egg odor and metallic taste. There is never any doubt as to when it is present due to its offensive odor. It promotes corrosion due to its activity as a weak acid; further, its presence in air causes silver to tarnish in a matter of seconds.

High concentrations of hydrogen sulfide gas are both flammable and poisonous. High concentrations of either iron or sulfide can foul the bed of an ion exchange softener.

There are many methods that dealers incorporate today to treat iron and hydrogen sulfide. Some of these include ozone, air injection, catalytic media and chlorine. Hydrogen peroxide (H2O2) is another method that can be used and has gained a lot of popularity because it is easier to handle, is a more powerful oxidizer and, in most cases, doesn’t require a contact tank. This translates to lower operating cost compared other types of chemical feed applications.

Hydrogen peroxide particulars

Hydrogen peroxide is a ”weak acidic, clear, colorless fluid, easily mixed with water in all proportions.” It is a clean oxidant that decomposes to H2O and O2, or more simply put, water with extra dissolved oxygen.

Hydrogen peroxide also occurs naturally. Our own bodies produce it naturally as a first line of defense against every single invading organism. Levels of 210 – 720 ppb have been reported in the breath of a normal healthy individual. It can also be found in coffee we drink and honey we eat.

Hydrogen peroxide is one of the most power oxidizers available. It is stronger than chlorine and potassium permanganate. Through catalysis, H2O2 can be converted into hydroxyl radicals (OH) with reactivity second only to fluorine.

Safety measures

Table-1-2-300x220-oxidativepower

As with any other oxidant, safety still needs to be considered when handling this product. Hydrogen peroxide of less than eight percent strength is considered non-hazardous. Most dealers today using hydrogen peroxide are using it at a seven percent concentration.

As a result, it can even be shipped through normal processes. This also means it can be safely delivered by a company vehicle without needing special registration or labeling on the truck.

There are many chemical supply companies that can provide it already mixed to a seven-percent solution. If you are delivering higher concentrations, check local and state regulations to determine what is required for proper registration and labeling.

Many dealers, however, have chosen to mix it themselves. While it is readily available at concentrations up to 35 percent, it should never be purchased at concentrations above this level.

Peroxide is very reactive above this level and requires extra care to handle it and, due to Homeland Security regulations and the quantity that might be kept at a facility, it can be purchased only at concentrations under 35 percent. (We purchase and store 34 percent concentrations at our facility and properly mix it to a seven-percent solution.)

Handling procedures

Whether you are handling a seven- or 35-percent solution, ensure that proper safety is used to handle and dilute. There are safety videos available from many of the suppliers and manufacturers of hydrogen peroxide.

The use of safety goggles to cover the eyes and protective gloves and aprons that are not affected by peroxide should always be used for proper handling while dispensing into containers. Leather gloves, for example, are not recommended for handling high concentrations of peroxide. It is very reactive to leather and can actually cause leather to ignite, even though peroxide itself is not flammable.

Customers should never be allowed to handle or dilute peroxide for safety reasons and for the risk of liability of the company providing it. The solution should be provided in a container that has a safety cap attached to prevent children from accessing it and should be properly vented.


Dilution procedures

Many dealers are purchasing 35 percent technical grade peroxide for diluting and using four gallons of water to one gallon of 35 percent peroxide. This works out to a 5.5 percent solution. Dealers should use this figure (5.5percent or 55,000 ppm) for the listed calculations listed to determine chemical feeder size and settings. Many chemical suppliers have seven-percent peroxide already available or can make it up in many cases. Be sure to determine what peroxide strength is being used and adjust for the calculations when sizing and setting chemical feeders1. It does not work as a simple ratio, however. Dilution calculations are only easy when you’re in the middle of a chemistry class in college. It would require a complete, separate article to provide a refresher course in chemistry to go through the calculations to determine how to properly dilute. Dealers need to know variables such as the density of water at different temperatures, as well as the densities of peroxide at the different dilution concentrations.

Again, the best course of action here is to contact the chemical supplier to either help determine the method of dilution or see if they will dilute the peroxide to your requirements. There are also companies available that are diluting and pre-packaging containers of seven-percent peroxide and making it available to dealers.


Peroxide grades

There are three basic grades of peroxide available: NSF grade, food grade and technical grade. Most dealers are using food or technical grade.

NSF grade is not readily available and is usually only found in concentrations of 35 percent. As soon as you dilute it, it would no longer be considered NSF grade.

A carbon filter is always incorporated to catch precipitated elements and remove any remaining peroxide residuals much like a chlorination system does. As such, it is acceptable to use food or technical grade unless it is to be used with a public water supply. In those cases, you may have to contact local authorities to determine if the NSF grade must be used.

It is important to know your actual concentration when setting up and properly dosing the required amount needed for the application. For those who dilute using a ratio of five parts water to one part of 35 percent peroxide, the resulting concentration is actually 4.6 percent.

This is assuming a water quality to dilute that is equal to one-two meg-ohm is being used. A double-pass RO system can achieve this type of quality.

Using water from a typical RO system will reduce the concentration and stability slightly. Generally speaking, hydrogen peroxide is stable with a decomposition rate of one percent per year when properly handled and stored.

Heat and sunlight can increase the decomposition rate significantly. If using tap water to dilute, the concentration of the solution is significantly reduced, as is the decomposition rate and should not be used. There are a couple of different methods to determine the resulting concentration by testing, weighing or measuring pH (if you know the densities or pH of the different concentrations).


Removing iron and sulfide

From this point, it is relatively easy to set up a system to remove iron or sulfide from water, limiting the maximum amount of iron to be treated to 10 mg/L of iron when using peroxide.

Peroxide systems for iron removal should be limited to less than 10 mg/l. Many problems will occur at higher levels. Hydrogen sulfide does not react the same way and there are no limitations to the amount that can be removed. Dealers have found great success when needing a system that can remove very high levels of hydrogen sulfide.

Limit applications to 20 mg/L unless you have support from companies with experience handling higher levels. The following table can be used as a guideline for the proper dosage of peroxide needed for each milligram per liter of either iron or hydrogen sulfide to be treated.

When compared to other oxidants such as chlorine and potassium permanganate, the dosage of peroxide needed is significantly less. Additional information needed to determine the chemical feed rate is gallons per minute (gpm) to be treated. With the gpm, total amount of iron and/or hydrogen sulfide known and the concentration of the peroxide solution to be used, you can use the following to determine the chemical feed rate required to treat the water.

  1. Determine the dosage of peroxide needed by determining the levels of iron and/or hydrogen sulfide and multiple the value with the highest amounts listed above. Most will use 0.4 ppm peroxide for each 1.0 ppm of iron; the amount required for sulfide is based on pH. The more alkaline (7.0>) the pH, the greater dosage required for each ppm of sulfide.
  2. With the dosage determined: (gpm X 1440 X Ddosage)/ (percent concentration of H2O2) = Chemical feed rate required. NOTE: Multiply the percent concentration by 10,000.

For example: (10 gpm X 1440 X 4.0 mg/L Dosage)/ (70,000) = 0.82 gpd feed rate. In this example, a small feeder can be used and set for 0.82 gpd output. Chemical feed pump suppliers can help determine which pump size to use and how to set it to the required rate if you are not familiar as to how to do this.

Most dealers use a peristaltic pump to inject the peroxide solution. It is not affected by the off-gassing of oxygen from the peroxide. It can be more difficult to use a positive displacement diaphragm pump because of off-gassing that could result in a loss of prime and prevents the peroxide from being injected.

The chemical feeder is usually set up to operate in conjunction with the homeowner’s well pump and is injected ahead of the pressure tank. The use of a static mixer (motionless, in-line mixer) is used in some cases to speed up the reaction of peroxide to oxidize iron and/or sulfide.

The static mixer becomes the injection point. It is unusual to use a contact tank with peroxide. The reaction rates are so much faster than other oxidants that it is usually not necessary. When using a contact tank, keep it smaller for just a few minutes of contact time.

Larger contact tanks have no additional value since peroxide breaks down much faster in water than other oxidants. In some cases, the use of a flowmeter or meter for proportional feed is used instead of the well switch.

This type of set up requires a little more time to calculate feeder dosage rate and can create more problems and maintenance needs than the first method discussed. As with other oxidants, pH and other factors need to be considered and addressed as with any other system.

Water filtration


peroxidesetup


The final step required is to filter the water of the precipitated elements and any peroxide residual just like a chlorine injection system. Carbon is recommended and always used with peroxide injection.

Use of oxidizing or catalytic media other than carbon is not recommended. Media containing manganese dioxide such as Birm® or Pyrolox can be rapidly destroyed and create other problems if improperly applied.

Many dealers use catalytic carbon to filter and remove peroxide residuals. It rapidly breaks down peroxide as it passes through the bed, which will usually ensure no carryover of peroxide to service.

There are a variety of different types of carbon available, such as coconut shell, that has been used successfully with peroxide. With any type of carbon filter:

  1. Check the backwash rate (gpm/ft2) required for your water temperature. Make sure it is backwashing frequently based on water usage per day. Typical applications will probably backwash every three days to keep the filter clean.
  2. Keep the flow rate through the filter bed as slow as possible. We recommend no more than 10 gpm/ft2 (square foot); five gpm/ftor less is recommended for the best performance.
  3. Make sure the carbon it is properly rinsed before it goes into service.
  4. Check peroxide residuals into and out of the filter to verify proper settings. Some dealers use peroxide test kits for this procedure, and others use ORP) meters to verify settings. Some use a simple bubble test, which is simply drawing a clear glass of water and verifying the micro bubbles leftover clear up rapidly (20 seconds or less) and will adjust feed rates accordingly. The best methods are testing the peroxide or ORP.
  5. As always, be sure to test for iron and sulfide after the filter to verify it is performing properly.

With proper steps taken prior to installation, peroxide can offer a great alternative to other solutions when handling difficult iron and hydrogen sulfide problems. Despite peroxide’s power, it is safe and versatile to use and decomposes into water and oxygen. It will provide iron- and sulfur-free water naturally, without using harmful chemicals.


Article Source:  WCP Online. Dec. 14, 2009.

Pure Water Gazette Fair Use Statement


3M Knew that PFAS Was Hazardous to Humans in 1950. It Is Still Being Produced.

Should 3M be required to pay for cleaning up the evironmental disaster created by its products?


In 1947, 3M began producing perfluorooctanoic acid (PFOA) by electrochemical fluorination.

In 1951, DuPont purchased PFOA from then-Minnesota Mining and Manufacturing Company for use in the manufacturing of teflon, a product that brought DuPont a billion-dollar-a-year profit by the 1990s. DuPont referred to PFOA as C8. The original formula for Scotchgard, a water repellent applied to fabrics, was discovered accidentally in 1952 by 3M chemists Patsy Sherman and Samuel Smith. Sales began in 1956, and in 1973 the two chemists received a patent for the formula. As far back as 1950, studies conducted by 3M showed that the family of toxic fluorinated chemicals now known as PFAS could build up in our blood. By the 1960s, animal studies conducted by 3M and DuPont revealed that PFAS chemicals could pose health risks. But the companies kept the studies secret from their employees and the public for decades.


Here is a timeline of some important events.


1950 – 3M mice study reveals that PFAS builds up in blood.

1956 – Stanford University study finds that PFAS binds to proteins in human blood.

1961 – DuPont toxicologist warns that PFAS chemicals enlarge rat and rabbit livers.
1962 – Volunteers who smoke PFAS-laced cigarettes get “polymer fume fever.”

1963 – 3M technical manual deems PFAS toxic.

1965 – DuPont rat study shows liver damage and increased spleen size.

1966 – The Food and Drug Administration rejects a DuPont petition to use PFAS chemicals as a food additive, citing liver studies. 1966 – 3M study finds that PFAS causes “acute oral toxicity” in rats.

1970 – 3M warns Fire Journal, the magazine of the National Fire Protection Association, that PFAS is toxic to fish. 1970 – DuPont scientists say PFAS is “highly toxic when inhaled.”

1973 – DuPont finds there is no safe level of exposure to PFAS in food packaging. 1975 – 3M is informed that PFAS builds up in human blood samples. 1975 – DuPont warns 3M about “toxic effects” of PFAS in food packaging.

1977 – 3M tests workers and animals to measure PFAS in blood. 1977 – 3M finds PFOS, the PFAS chemical in the company’s Scotchgard fabric treatment, “more toxic than anticipated.”

1978 – 3M animal tests find lesions on spleen, lymph nodes and bone marrow.

1978 – 3M concludes that PFOS and PFOA, a PFAS chemical used to make DuPont’s Teflon, “should be regarded as toxic.”

1979 – DuPont survey of employees in its Parkersburg, W.Va., Teflon plant finds possible evidence of liver damage.

1981 – 3M and DuPont reassign female workers after animal studies reveal PFAS damages the eyes of the developing fetus.

1983 – 3M identifies PFAS’ potential harm to the immune system as a cause for concern.

1984 – 3M documents rising fluorine levels in workers’ blood.

1984 – DuPont detects PFAS in the tap water in Little Hocking, Ohio, but does not alert the local water utility.

1987 – 3M PFOA animal study finds tumors.

1989 – 3M study finds elevated cancer rates among PFAS workers.

1990 – 3M study finds risk of testicular cancer from exposure to PFOA, also known as C8.

1992 – DuPont study finds elevated cancer rates among workers.

1992 – Former 3M scientist finds male PFOA workers more likely to die from prostate cancer.

1995 – DuPont scientist expresses concern over long-term PFAS health effects.

1997 – DuPont study finds heightened cancer rates among workers at the Parkersburg plant.

1998 – 3M scientists report that PFAS moves through the food chain.

1998 – 3M provides EPA evidence that PFAS accumulates in blood.

1998 – 3M animal study finds liver damage from PFAS exposure.

1999 – 3M scientist describes PFOS as “the most insidious pollutant since PCB.”

2000 – 3M animal study finds liver damage from PFOS exposure


Information Sources

EWG

Wisconsin Dept. of Health Services

Wikipedia