

As Water Scarcity Increases, Desalination Plants Are on the Rise

by Jim Robbins


Some 30 miles north of San Diego, along the Pacific Coast, sits the Claude “Bud” Lewis Carlsbad Desalination Plant, the largest effort to turn saltwater into freshwater in North America.

Each day 100 million gallons of seawater are pushed through semi-permeable membranes to create 50 million gallons of water that is piped to municipal users. Carlsbad, which became fully operational in 2015, creates about 10 percent of the fresh water the 3.1 million people in the region use, at about twice the cost of the other main source of water.

Expensive, yes, but vital for the fact that it is local and reliable. “Drought is a recurring condition here in California,” said Jeremy Crutchfield, water resources manager at the San Diego County Water Authority. “We just came out of a five-year drought in 2017. The plant has reduced our reliance on imported supplies, which is challenging at times here in California. So it’s a component for reliability.”

A second plant, similar to Carlsbad, is being built in Huntington, California, with the same 50-million-gallon-a-day capability. Currently there are 11 desalination plants in California, and 10 more are proposed.

The cost of desalinated water has been coming down as the technology evolves and the cost of other sources increases.

It’s been a long time coming for desalination — de-sal for short. For decades, we have been told it would one day turn oceans of saltwater into fresh and quench the world’s thirst. But progress has been slow.

That is now changing, as desalination is coming into play in many places around the world. Several factors are converging to bring new plants on line. Population has boomed in many water-stressed places, including parts of China, India, South Africa, and the United States, especially in Arizona and California. In addition, drought — some of it driven by a changing climate — is occurring in many regions that not that long ago thought their supplies were ample.

San Diego is one of those places. With just 12 inches of rain a year in the Mediterranean climate of Southern California and no groundwater, the region gets half of its water from the distant Colorado River. The amount of snow that falls in the Rocky Mountains and keeps that mighty river flowing, however, has greatly diminished over the last two decades and according to some researchers may be part of a permanent aridification of the West. Climate change is a very real phenomenon for water managers throughout the Southwest and elsewhere.

Meanwhile, the cost of desalinated water has been coming down as the technology evolves and the cost of other sources increases. In the last three decades, the cost of desalination has dropped by more than half.

A boom in de-sal, though, doesn’t mean that everywhere with access to the sea has found a new source of freshwater. Circumstances play a large role. “As populations increase and existing surface water supplies are being tapped out or groundwater is depleted or polluted, then the problems are acute and there are choices to be made” about de-sal, said Michael Kiparsky of the Wheeler Water Institute at the UC Berkeley School of Law. “There are places around the world where de-sal makes economic sense, where there is high pressure on the water resources plus a lot of available energy resources,” such as the Middle East.

De-sal proponents acknowledge the industry must confront and solve some serious environmental issues if it is to continue to grow. Desalination requires vast amounts of energy, which in some places are currently provided by fossil fuels. Kiparsky warns of a feedback loop where more de-sal is needed as the planet warms, which leads to more greenhouse gas emissions. In addition, there are serious concerns about the damage to marine life from the plant’s intake systems and extra-salty wastewater.

The first large-scale de-sal plants were built in the 1960s, and there are now some 20,000 facilities globally that turn seawater into fresh. The kingdom of Saudi Arabia, with very little freshwater and cheap energy costs for the fossil fuels it uses in its de-sal plants, produces the most freshwater of any nation, a fifth of the world’s total.

Australia and Israel are also major players. When the Millennium Drought gripped southeastern Australia from the late 1990s until 2009, water systems in the region dropped to small fractions of their storage capacity. Facing a crisis, Perth, Melbourne, and other cities embarked on a large desalination plant spree. The plant in Melbourne, which provided its first water in 2017, cost $3.5 billion to build and provides a third of the city’s supply. It’s critical because the region has had below-average rainfall for 18 of the last 20 years.

Israel, too, is all-in on desalination. It has five large plants in operation, and plans for five more. Chronic water shortages there are now a thing of the past, as more than half of the country’s domestic needs are met with water from the Mediterranean.

Globally, more than 300 million people now get their water from de-salination plants, according to the International Desalination Association.

But despite the need, de-sal plants will not be built on every coastline. Foremost among the barriers is the cost of constructing a plant and the cost of processing the water. The San Diego County Water Authority pays about $1,200 for an acre-foot of water sourced from the Colorado River and the Sacramento San Joaquin River Delta and pumped hundreds of miles to Southern California. The same amount from the Carlsbad plant — enough to supply a family of five for a year — costs about $2,200. As Lake Mead — the reservoir of Colorado River water on the Nevada-Arizona border that supplies San Diego — drops precipitously, it may someday, perhaps in the next several years, no longer be able to supply San Diego. Certainty is paramount.

De-sal, however, is plagued by some serious environmental problems. There are two types of desalination – thermal, which heats up water and then captures the condensation, and reverse osmosis, which forces seawater through the pores of a membrane that are many times smaller than the diameter of a human hair. This traps salt molecules, but allows the smaller water molecules to go through. Both require a great deal of energy, and greenhouse gas emissions created by the power needed — especially in the Middle East, where fossil fuels generate electricity — are a significant contributor to global warming.

There are ecological impacts as well. It takes two gallons of seawater to make a gallon of freshwater, which means the gallon left behind is briny. It is disposed of by returning it to the ocean and — if not done properly by diffusing it over large areas — can deplete the ocean of oxygen and have negative impacts on sea life.

A study by the U.N. Institute for Water, Environment and Health published earlier this year contends that the problem of brine waste has been underestimated by 50 percent and that, when mixed with the chemicals meant to keep systems from fouling, the brine is toxic and causes serious pollution.

Another problem comes from the sucking in of seawater for processing. When a fish or other large organism gets stuck on the intake screen, it dies or is injured; in addition, fish larvae, eggs, and plankton get sucked into the system and are killed.

“At our intake we [draw in] tiny little organisms, that amount to about a pound and a half of adult fish per day,” said Jessica Jones, a spokesperson for Poseidon Water, which owns the Carlsbad plant. “To mitigate that we are restoring 66 acres of wetlands in San Diego Bay. And we just got a new intake permitted which will lessen the impacts.”

According to Heather Cooley, research director at the Pacific Institute, “There are a lot of unknowns around the impact on sea life. There hasn’t been a lot of monitoring at the facilities.” A strategy increasingly being used to obviate, or reduce, that problem is to bury the seawater intakes beneath the seafloor and use the sandy ocean bottom as a natural filter.

In 2016, California passed the Desalination Amendment, which tightened regulations for intake and brine disposal. Proponents of desalination contend the changes have been onerous and are slowing the march toward a de-sal future.

Because of the cost of seawater processing and the impacts on the ocean, much of the recent desalination growth has involved the use of brackish water. The solids in brackish water are one-tenth the amount in ocean water, and that makes the process much cheaper.

Arizona, perpetually short on water and facing a Colorado River supply shortage, is looking at both a seawater de-sal plant in partnership with Mexico — which has the ocean access that the state lacks — and at plants that can treat the 600 million acre-feet of brackish water deposits the state estimates it has.

Texas, meanwhile, now has 49 municipal de-sal plants that process brackish water, both surface and subsurface. San Antonio currently is building what will be the largest brackish water de-sal plant in the country. In its first phase, it produces 12 million gallons a day, enough for 40,000 families, but by 2026, the plant — known as H2Oaks — will produce 30 million gallons a day. Brackish water de-sal costs $1,000 to $2,000 per acre-foot.

The Pacific Institute’s Cooley argues that before building de-sal plants, municipalities should fully implement conservation programs, promote potable re-use — the re-use of wastewater, also known as toilet-to-tap recycling — or treat storm water runoff. “It makes sense to do the cheaper options first and leave the more expensive options down the road to be developed when you need them,” she said.

Reprinted from Grist.   Published originally in YaleE360.

Pure Water Gazette Fair Use Statement

Chemical Dosage Instructions for Pure Water Products’ Chemical Feed Systems

Spectraguard: Dosing to protect large RO units from hardness and iron damage. These are “round number” recommendations for dosing concentrated Spectraguard liquid for the Watts RO units that we supply. Settings are for the Stenner 0.2-3.0 gpd peristaltic pump.

Watts RO Unit

Solution Mixture

(amount of Spectraguard 111 added to 12.5 gallons of clean water)

Pump Setting

(using Stenner 0.2 – 3.0 gpd pump)

R12 –

600 GPD

1/4 cup 4

R12 –

1200 GPD

1/4 cup 6

R4x40 –

2200 GPD

1/2 cup 4

R4x40 –

4400 GPD

1/2 cup 6

R4x40 –

6600 GPD

1 cup 5


gardenhosesculpure02

Happy Garden Hose Day

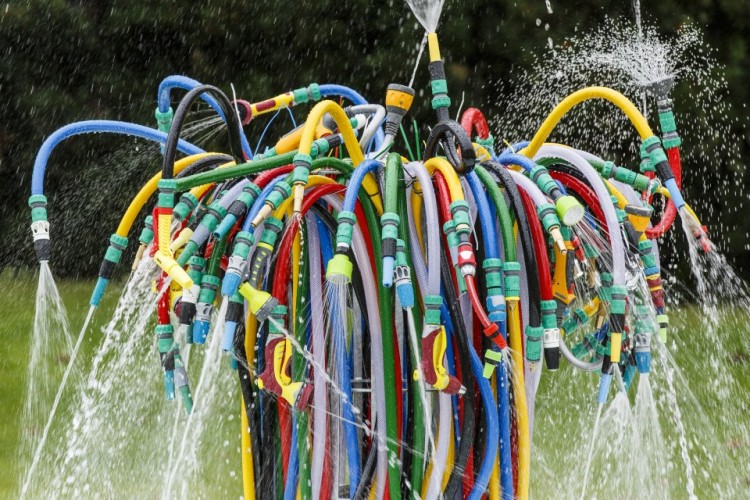
The stately lawn of the Serpentine Sackler Gallery in London’s Kensington Gardens was for a year home to a unique sight–a sculptural fountain made of an unruly jumble of ordinary garden hoses. French artist Bertrand Lavier created the sculpture, entitled Fountain, for a yearlong installation that ended October 4, 2015. Lavier specializes in sculptures made of “found objects.”

Lavier’s piece reminds us of the grace, the versatility, and the beauty of the common garden hose as the nation celebrates National Garden Hose Day on June 18.

GardenHoseDayJune18

PFAS Producers Face Increasing Legal Onslaught


The Associated Press reports a landslide of litigation directed at companies responsible for the nation’s PFAS crisis:

Residents of a small Delaware town, Blades, whose water supply is contaminated by chemicals linked to health issues ranging from cancer to infertility are suing several companies who manufactured the chemicals.

The News Journal of Wilmington reports the five Blades residents say they have high blood levels of perfluoroalkyl and polyfluoroalkyl substances, also called PFAS. Their lawsuit seeks to become certified as a class-action against a defunct metal plating company, 3M, DuPont and Chemours.

This lawsuit’s just one of many against the latter three companies by states including New York and New Hampshire, as well as smaller scale litigations. DuPont and Chemours agreed last year to settle lawsuits in West Virginia for $670 million. U.S. Sen. Tom Carper asked Congress this week to pass bills seeking to regulate and classify PFAS.


World’s rivers are contaminated with dangerous levels of antibiotics, study finds

Scientists detect drugs in two-thirds of waterways as part of first ever global study

by Phoebe Weston

Rivers around the world are contaminated with dangerous levels of antibiotics, according to a major new study.

Concentrations of antibiotics in some waterways exceed safe levels by 300 times, a global team of scientists led by the University of York found.

The Thames was contaminated with five antibiotics, including levels of ciprofloxacin – used to treat skin and urinary tract infections – that were three times what is considered safe.

Researchers looked at 14 commonly used antibiotics in rivers flowing through 72 countries and found antibiotics were in two-thirds of samples.

Scientists fear antibiotics in rivers cause bacteria to develop resistance meaning they can no longer be used in medicines for humans. The UN estimates that the rise in antibiotic resistance could kill 10 million people by 2050.

“A lot of the resistance genes we see in human pathogens originated from environmental bacteria,” Professor William Gaze, a microbial ecologist at the University of Exeter who was not involved in the study, told The Guardian.

Drugs get into rivers via human and animal waste, as well as leaks from wastewater treatment and drug manufacturing sources.

In one site in Bangladesh, levels of metronidazole – which is used to treat mouth and skin infections –​ were 300 times greater than what is considered safe. The most common antibiotic was a urinary tract infection antibiotic called trimethoprim, which was present in 307 of 711 sites tested.

Scientists flew out 92 testing kits to partners across the world who took samples from local rivers. Researchers found Bangladesh, Kenya, Ghana, Pakistan and Nigeria were home to the most contaminated rivers. The team said that the safe limits were most frequently exceeded in Asia and Africa.

However, sites in Europe, North America and South America also had high levels of contamination showing that antibiotic contamination was a “global problem”.

Professor Alistair Boxall, from the York Environmental Sustainability Institute, said: “The results are quite eye opening and worrying, demonstrating the widespread contamination of river systems around the world with antibiotic compounds.

“Many scientists and policy makers now recognise the role of the natural environment in the antimicrobial resistance problem. Our data show that antibiotic contamination of rivers could be an important contributor.

“Solving the problem is going to be a mammoth challenge and will need investment in infrastructure for waste and wastewater treatment, tighter regulation and the cleaning up of already contaminated sites.”
Professor John Wilkinson, from the University of York, said: “Until now, the majority of environmental monitoring work for antibiotics has been done in Europe, North America and China. Often on only a handful of antibiotics. We know very little about the scale of problem globally.

“Our study helps fill this key knowledge gap with data being generated for countries that had never been monitored before.”

The findings will be unveiled at the annual meeting of the Society of Environmental Toxicology and Chemistry in Helsinki on 27 and 28 May.

Source: The Independent.

Pure Water Gazette Fair Use Statement

A Common Sense Approach to Residential PFAS Treatment

by Emily McBroom and Gene Franks

Most of the information now available about how to remove PFAS from water focuses on the gigantic carbon filters made to treat the millions of gallons of water per day required by cities.  Also mentioned are the very small residential drinking water filters, mainly carbon filters, that have received NSF certification for PFAS removal from drinking water.There is a lot of confusion about the residential applications that fall between the gigantic and the tiny.

Here are some things to consider about residential applications for PFAS reduction.

  1. Consensus is that three treatment strategies work with PFAS: carbon filtration, reverse osmosis, and ion exchange. Of these, carbon (GAC) filtration seems most practical for municipalities. GAC and reverse osmosis both work well for residential users, with reverse osmosis an easy first choice for drinking water. One agency tested eleven separate undersink reverse osmosis units and found that they all removed PFAS well. Several pretty unassuming carbon filters have gained NSF certification for PFAS reduction.
  2. Those who recommend treatment equipment for residential applications almost always make an unfounded assumption that homes must use point of entry equipment, treating all the water going into the home. We find no convincing information to indicate that PFAS in water is anything other than an ingestion issue.  According to the CDC’s Agency for Toxic Substances Disease Registry:   “Studies have shown that only a small amount of PFAS can get into your body through your skin. Therefore, showering and bathing in water containing PFAS should not increase exposure. Washing dishes in water containing PFAS should not increase exposure.”
  3. For point of entry treatment, we found that almost all recommended treatments are simply scaled-down versions of the strategies developed for municipalities.  Usually there is no rationale stated that would justify the sizing recommendation. Recommended sizes range from extra large to even larger. We found EBCT (Empty Bed Contact Time) recommendations for PFAS ranging from 6 to 16.  Ten is a common recommendation. Using an EBCT of ten, to provide a modest service flow of five gallons per minute for a residential whole house filter for PFAS one would need almost 7 cubic feet of granular carbon.  That’s a 21″ X 72″ carbon tank, or three or four 12″ X 52″ tanks installed in series, or five 10″ X 54″ tanks installed in series.  One authority recommends “at least 200 pounds of GAC” for residential whole house treatment–a 7 cubic-foot filter array.  That’s a lot of equipment to assure PFAS-free water for flushing toilets. The most commonly suggested point of entry system is for two 12″ X 52″ GAC filters installed in series, without regard to family size. This would provide an EBCT of 6 at 5 gpm.
  4. No one offers information about PFAS performance for whole house sized carbon block filters, although carbon block units might offer the most practical PFAS whole house option.

The Obvious Conclusions

Our advice to consumers is get an undersink RO unit. If you don’t want reverse osmosis, get a high quality undersink or countertop carbon drinking water filter with an ample amount of carbon, and service it regularly. Ignore PFAS as a point of entry treatment issue, but don’t drink water from the bathtub. Treat your drinking water well, and add a whole house carbon filter if you want to, but  you don’t have to get a box-car sized filter that competes with the city water department because if your drinking water is taken care of, a little PFAS in the shower water won’t matter.

Lead and Treatment


Posted May 7th, 2019

Lead


 Lead’s EPA Maximum Contaminant Level Goal is 0.015 mg/L  (15 parts per billion).

Lead is a toxic metal that was regularly used in a wide range of household and industrial products throughout much of the last century, and found in plumbing and service lines until the EPA established a lead ban in 1986.

Lead rarely occurs naturally in water. When found, it is usually a result of industrial, smelting or mining wastes, or from corrosion of plumbing.

Health Effects of Lead

Lead is toxic to all humans, but the risk of lead poisoning is highest in children and pregnant women. Children absorb 30-75%, adults only 11 percent.

The EPA lists several symptoms associated with acute lead poisoning:


Lead can cause a variety of adverse health effects when people are exposed to it at levels above the action level [15 parts per billion] for relatively short periods of time. These effects may include interference with red blood cell chemistry, delays in normal physical and mental development in babies and young children, slight deficits in the attention span, hearing, and learning abilities of children, and slight increases in the blood pressure of some adults.


The agency also warns that lead is a potential carcinogen, and can lead to kidney disease or stroke with long term exposure.

Water Treatment for Lead

Lead can be treated with ion exchange (water softeners) or reverse osmosis. It can also be treated by removing the source, or through corrosion control methods in pipes, including: pH and alkalinity adjustment; calcium adjustment; silica or phosphate-based corrosion inhibition. Point of use filters containing special lead-removal resins or KDF 55 are also very effective for providing lead-free drinking water.

Here are options for lead treatment offered by Pure Water Products, LLC:

The Model 77 countertop filter and choose a MatriKX Pb1 cartridge for lead reduction – http://www.purewaterproducts.com/model-77-countertop-water-filter

The Double Undersink Filter – http://www.purewaterproducts.com/products/uf002

Undersink Reverse Osmosis unit – http://www.purewaterproducts.com/products/ro050


Flushable Wipes Are Rated as the Number One Problem at NYC’s Largest Wastewater Disposal Plant

flushablewipes


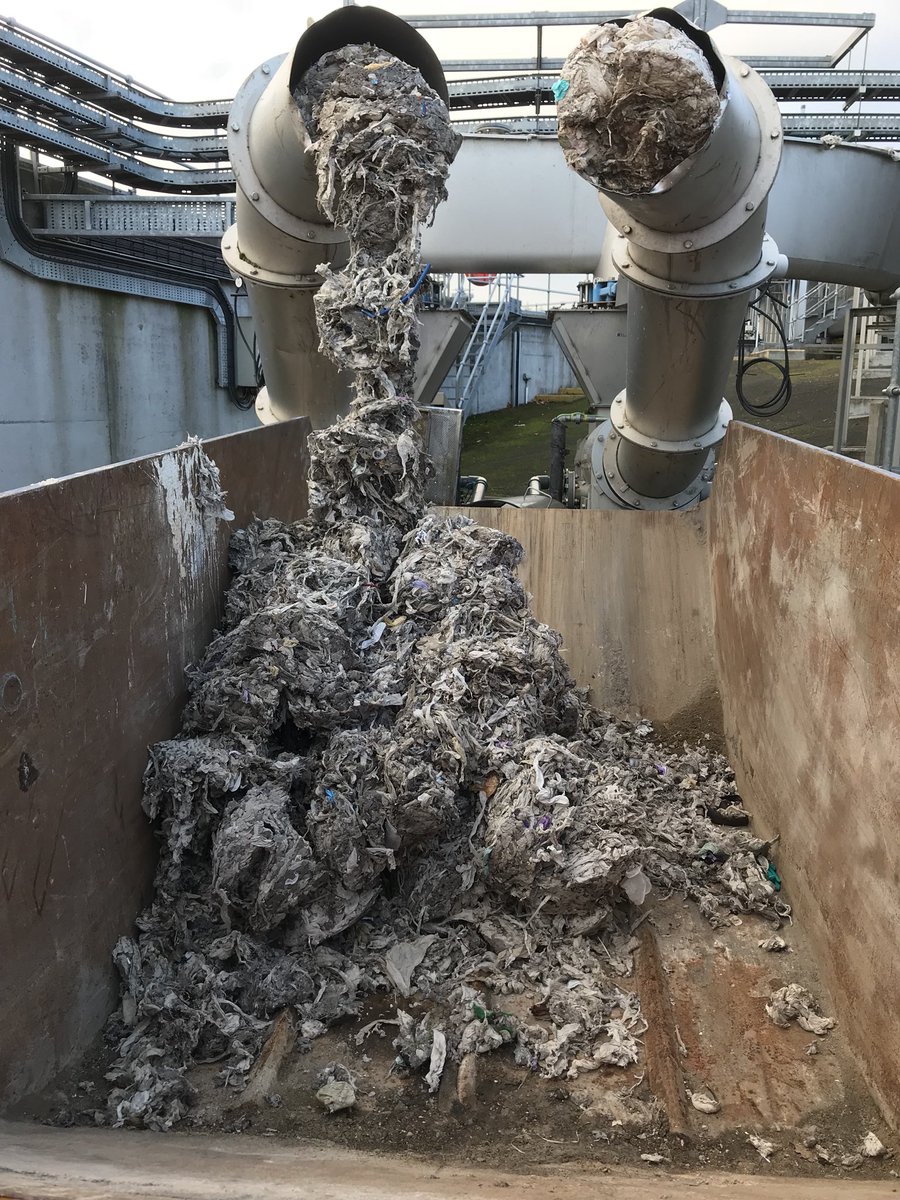
New York city’s 14 wastewater treatment plants have to process 1.3 billion gallons of wastewater per day (twice that when it rains) gathered from 6,000 miles of pipes. The the largest of these, the Newtown Creek Plant, which covers about 50 acres, processes about 310 million gallons daily. The plant spends around $19 million per year just cleaning out clogs caused mainly by so-called “flushable”wipes.  When these wipes congeal with grease also dumped down drains, “fatbergs” result.

Efforts at legislation and judicial action to keep the wipes from being sent down the city’s toilets have largely failed due to industry resistance.

The Invisible Nightmare in Your Fleece

Washing a single polyester jacket can send 1,900 tiny synthetic micro-fibers into waterways, where they can soak up toxins and get eaten by fish. So what is the outdoor industry doing about it?

by Mary Catherine O’Connor


Gregg Treinish is dismayed about what is coming out of his washing machine.

“What I’m seeing is shocking. Every couple of weeks, I clean out the filter and put the contents in a 32-ounce Ball jar,” says the founder of Adventurers and Scientists for Conservation (ASC), a nonprofit that trains outdoor enthusiasts to collect data for environmental researchers. After roughly two months, Treinish says, “the bottle is more than half-full of the crap that would have otherwise been shed right into the waterway.”

That crap is thousands of synthetic fibers shed from Treinish’s clothing during wash cycles (he captures them in an aftermarket filter), and the waterway is Montana’s Gallatin River. Treinish, whose organization receives financial support from a number of outdoor-gear companies, recently launched a campaign to track the flow of those fibers into fresh water. He plans to share that data with his funders.

What’s so bad about a few plastic threads? In 2011, British ecologist Mark Anthony Browne published a study describing the discovery of micron-scale synthetic fibers, mostly polyester and acrylic, in sediments along beaches the world over, with the highest concentrations appearing near wastewater-disposal sites. That strongly suggested that the micro-fibers came from apparel, a hunch he checked by filtering 1,900 fibers found in the waste-water from washing a single fleece jacket. A similar study at VU University Amsterdam in 2012 estimated that laundry wastewater is sending around two billion synthetic microfibers per second into Europe’s waters.

Of course, wool and cotton clothing sheds fibers, too. But those materials biodegrade. Plastics contain potentially harmful additives and can absorb toxins, including polychlorinated biphenyls (PCBs), that they encounter floating in waterways—and then get ingested by small organisms, crustaceans, and fish. These particles can accumulate in the animals’ guts and tissues, potentially weakening immunity or disrupting their endocrine systems. Less is known about how that payload may accumulate up the food chain.

New research shows that microfibers are even more abundant in our lakes and rivers than microbeads from shampoo and body wash, which have been banned in seven states. “We tested effluent from wastewater-treatment plants and found that 85 percent of the plastic it contained was fibers, whereas beads and other fragments only made up 13 percent,” says Sherri Mason, a professor of chemistry at the State University of New York at Fredonia. “Is it rocket science to assume those fibers are going to end up in some body of water?”

So while Treinish’s half-full Ball jar might not seem like a big deal, it represents a very thin slice of an incalculably large pie. And he believes that manufacturers are going to have to address their role in microfiber pollution sooner rather than later. “Apparel companies are realizing that once news about microfibers hits the mainstream media,” Treinish says, “they’re going to have some major issues to contend with.”

In 2013, Browne tried to form a coalition with big outdoor-industry brands, including Patagonia and Polartec, to track micro-fibers to their manufacturers. Most of the companies that responded declined to join Browne’s effort, saying they wanted to learn more about the problem—and how serious their role in it is.

That’s a hard question to answer. According to 2010 figures from the United Nations’ Food and Agriculture Organization, roughly half of all the clothes bought in developed countries—and 68 percent in the developing world—are synthetic. Your home is likely festooned with synthetic fibers as well, from carpeting to couch covers. But how often do you wash those items, compared with your polyester base layers, ski socks, fleece jackets, and pullovers?

Much of the clothing in question isn’t gear at all—hello, jeggings! But outdoor brands have long relied on the performance attributes of synthetic fabrics. Combined with chemical coatings and membranes, they can be both waterproof and breathable. While warm, odor-resistant wool has recently seen a bump in use for outdoor apparel, the market’s dependence on synthetics hasn’t changed.

As one industry source pointed out to me, so far there is no miracle fiber that is both high performing and environmentally benign. Conventionally grown cotton, for instance, requires significantly more water to produce than synthetics, utilizes far more land, and relies heavily on fertilizers and pesticides. And some manufacturers, environmentalists, and scientists, including Browne, suggest that the appliance industry should bear some of the responsibility, since washing machines don’t filter out small particles and add-on filters like the ones Treinish uses, which are designed to keep lint out of septic tanks, still don’t catch the tiniest fibers.

That said, the performance-apparel community is beginning to look inward. The Outdoor Industry Association’s Sustainability Working Group, which represents 250 companies, has started to examine the issue, with cooperation from marine-debris specialists at the Ocean Conservancy. The investigation is still in its infancy, cautions Beth Jensen, OIA’s director of corporate responsibility. “You can’t mobilize an industry around an issue until you have all the facts,” she says. “But we do recognize the urgency around microfibers, and we want to move forward.”

Among individual brands, Patagonia has taken the most concrete steps in that direction. Though it declined Browne’s request to work together, the company is collaborating with the Bren School of Environmental Science and Management at the University of California at Santa Barbara to identify which synthetic materials in its supply chain shed fibers. “Everything we learn from this project will be useful information,” says Adam Fetcher, Patagonia’s communications director, “whether we find that we are part of the problem or not part of the problem or somewhere in between.”

Other brands I called, like Polartec and the North Face, elected not to comment. Columbia Sportswear, which was the target of an online petition initiated by anti-plastics group the Story of Stuff, provided a statement from Peter Haney, its manager of corporate responsibility. “Columbia is in the early stages of reviewing Dr. Browne’s initial research,” he wrote. “We will continue to be involved through industry-wide collaborations like OIA’s Sustainability Working Group.”

For now, the most significant progress is taking place in Europe, where a new research consortium called Mermaids, funded by the European Commission and promoted by the Netherlands’ Plastic Soup Foundation, is dedicated to reducing microfiber shedding by 70 percent. The first step is to identify the worst culprits. Browne and others are working to develop a process that can trace a polyester or nylon thread back to its point of origin by identifying the fingerprint left behind by manufacturing dyes and chemicals. The plastics in medical implants go through a battery of certifications before they’re used in human bodies, he argues. Why shouldn’t consumer plastics undergo equally rigorous trials to determine their impact on aquatic ecosystems?

That may be a long way off. “Hey, I live in Maine, and I could not live without my fleece,” says Kara Lavender Law, a microplastics researcher at the Sea Education Association. “The big question is: Where should we be using plastic? It’s clearly a very useful, beneficial material, but maybe it’s time to reconsider wool or other materials that were replaced with synthetics.”

Pure Water Gazette Fair Use Statement

Does the Permeate Pump Save Water?

by Gene Franks

permpump_306

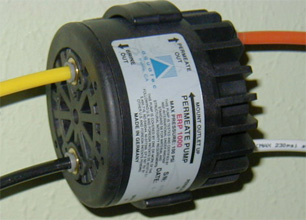
The permeate pump has been a popular accessory for domestic undersink reverse osmosis (RO)  units for a number of years. It is a non-electric, water-powered device that works by isolating the RO membrane from back pressure from the storage tank.

Standard undersink RO units produce water into a small pressurized storage tank.  As the tank fills, the RO unit has to push against increasing back pressure from the storage tank. The greater the back pressure, the more inefficient the RO unit becomes. Standard undersink RO units that store water in a pressure tank never perform as well as the membrane rating. A 4:1 (four gallons to drain for each gallon of product water) membrane, when used on a standard undersink RO unit, actually performs much less efficiently because of back pressure from the storage tank. In informal tests that we did at Pure Water Products, actual efficiency performance of a standard RO in simulated home usage was around 7:1. The unit performed at 4:1 when the tank was empty but the efficiency got progressively worse as pressure built in the storage tank.

The purpose of the permeate pump is to allow the RO unit to produce water into an almost pressure-free chamber. The pump then pushes the stored water into the the pressurized storage tank. Water leaves the RO membrane housing in two streams: the purified water (permeate) and the reject or drain water (brine).  The pump uses the energy from the brine to push the permeate into the storage tank.

The pump manufacturer claims that the pump will save water and also improve the TDS  performance of the RO unit. This is discussed in detail, with manufacturer’s charts, in a 2011 issue of the Pure Water Occasional.

An earlier Pure Water Gazette piece reported an informal test done with a single home RO unit that looked at the question of whether the pump improved TDS rejection performance as claimed by the manufacturer.  The test showed no improvement in TDS performance with the pump as compared with the same unit without the pump.

The TDS test was done with a standard Black & White  undersink RO unit with the GRO 50/50 water saving membrane. The membrane performance rating is 1:1–one gallon of brine for one gallon of permeate.  The same unit, now a year older, was used to test the permeate-to-brine efficiency with and without the permeate pump.

We ran six trials: three with a standard unit without permeate pump and using the regular Payne shutoff valve, and three with an Aquatec ERP 500 permeate pump installed and the same Payne shutoff.

Discussion

Standard RO membranes are set up with a ratio of about 4 (drain) to 1 (permeate).  With no tank to push back against, a 24 gpd membrane installed with a 250 ml/m drain line flow restrictor will run about 95 gallons of water to drain while producing 24 gallons of drinking water. This works out to around a 4:1 ratio. The GRO 50/50 membrane used in this test is a 50 gpd membrane, paired with a 150 ml/m brine restrictor, so the theoretical production is 50 gallons of permeate while sending 57 gallons to drain. Essentially a 1:1 ratio.  (To convert milliliters per minute to gallons per day, multiply by 0.38.)  Significantly, a smaller-than-usual storage tank was used to move things along faster. The tank is about a 7.5″ X 9″ petite version, which the manufacturer calls a “2 gallon” size, but which for practical purposes holds about one gallon.

The trial consisted simply of starting with a full tank, draining the tank to catch and measure the content, then allowing the RO unit to refill the tank while catching the brine for measurement. Three trials each were done with and without the pump. Results were surprisingly uniform. The table below reports the averages in percent recovery, which means the percentage of the water that goes into the RO unit that comes out as permeate.  Keep in mind that a standard 4:1 membrane setup without tank has a percent recovery ratio of about 20%; with a tank in a standard residential setting the percent recovery might be 12%.

The Test with GRO Membrane


Setup Total Permeate in fluid ounces Total Brine in fluid ounces Recovery Percentage  
GRO Membrane, without pump 114 (0.89 gal.) 160 (1.25 gal.) 41.6%
GRO Membrane, with pump 120 (1.07 gal.) 118 (0.92 gal.) 50.4 %

The conclusion is, then, that the permeate pump does indeed save water, even when running with the stingy GRO membrane. With a conventional 4:1 membrane, the saving is more pronounced. Permeate pump manufacturer Aquatec’s performance chart shows conventional membrane performance with the pump at about 12:1 when the storage tank is 60% full. Our tests show overall performance of conventional units averages about 7:1 under normal stop and go residential use, while the permeate pump unit with the same membrane maintains a consistent 4:1 throughout the fill cycle.

One final note about the GRO 50/50 membrane. Although it would appear from the 41% recovery that it is performing at less than the advertised 50% recovery rate, its performance is really quite remarkable. The 50% setup is the performance you get without a tank (as in a tankless “countertop” RO unit). You should get the essentially same performance with a permeate pump, whose job it is to nullify the back pressure from the storage tank. That is what we got in our test.

Here is a summary of simulated performance figures to put all this in perspective:

Setup   Approximate Recovery Percentage
 Standard membrane in undersink standard RO with tank  12%
 Standard membrane in tankless countertop RO  20%
 Standard membrane in undersink RO with permeate pump  20%
GRO membrane in tankless countertop RO 50%
GRO membrane in undersink RO without permeate pump 40%
GRO membrane in undersink RO with permeate pump 50%

Adding a permeate pump to a standard RO unit improves its recovery percentage by around 10%.  Replacing the standard membrane with a 50/50 GRO membrane increases recovery by about 30%.

Does this mean, then, that you  should always buy an RO unit with a permeate pump?  Not at all. There is more to be considered that water saving. The permeate pump makes the RO unit a more complicated device that can be a bit harder to install, harder to maintain and more difficult to troubleshoot if there is a problem. It also makes some noise, although the current version ERP-500 model is very quiet. Saving 8% or 10% in water consumption may not be worth it.

If saving water is the main objective, I suggest adding the GRO membrane first, and then the permeate pump.