Proprietary Water Filters vs. Standard Models
The most “standard” size in point of use drinking water filters uses 2.5″ x 9.75″ replaceable filter cartridges. Over the years the 2.5″ X 9.75″ cartridge (we call it Size 1) has dominated the industry. Virtually all cartridge makers offer cartridges in this size. Wide use encourages a competitive market, hence lower prices, and a big variety of products to choose from.
Not all filters are made in standard size, however. Some manufacturers create unique filter styles that can have advantages and disadvantages. One advantage is convenience in the form of easy-to-replace filter elements in which the housing itself is discarded. This means easier replacement but greater cost and limited choice in replacements.
A major disadvantage of buying a water filter with proprietary replacement parts is that you are dependent upon the manufacturer to stay in business and continue to supply replacement elements. Most basic drinking water filters are durable products that will last for years, but if the product disappears from the market after a couple of years your only option is to discard the unit and replace it. This happens often. In fact, it is a sales strategy of some makers who regularly discard proprietary filtration units to force replacement with “improved” (slightly different) units.
Below, for comparison, are examples of proprietary and standard filtration units. Both models shown are “simple” undersink filters–filters that treat all the cold water at the sink and dispense the filtered water through the cold-water side of the regular sink faucet. Simple undersink units are easy to install because no extra faucet for drinking water is needed. The principles in this article also apply to regular undersink filters that need their own faucet and to undersink reverse osmosis units.
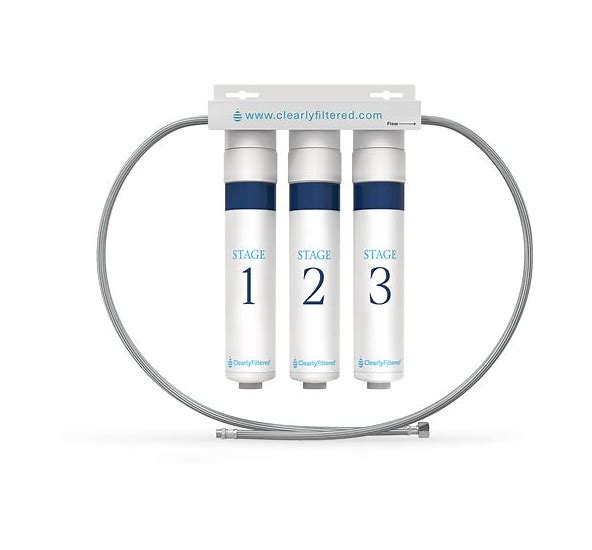
The unit pictured above is a respected proprietary unit which features regular city water treatment including fluoride removal. Although the manufacturer does not give specifics about the standard 3-filter replacement package, the expectation would be that one is a sediment cartridge, one a carbon block cartridge, and one a fluoride removal cartridge. The unit features easy-to-change disposable cartridges. Go here for more information and purchase details.
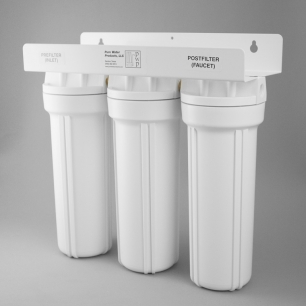
Pictured above is a Pure Water Products Standard Simple Undersink Filter. It is offered with many standard 2.5″ x 10″cartridges to select from, including several carbon block filters, several sediment cartridges, carbon block cartridges with lead removal and cyst removal built in, both coconut shell and standard carbons, fluoride and nitrate removal–in other words, a lot of treatment styles to choose from so that the final product can be tailored to the customer’s local water.
Comparative Chart
| Filter Model | Proprietary 3-Stage Undersink Filter with unique replacement cartridges. | Pure Water Products Simple Undersink 3-Stage Filter with standard-sized cartridges and housings. |
| Internet Price for the unit. | $550 complete with one set of cartridges | $90, without cartridges. The customer chooses cartridges from a large variety available, and the cartridge price is added to the $90 basic unit. A typical set of the very best city water cartridges would add $79. Optional installation kit is $16. Typical total price for everything would be about $185, shipping included. |
| Price of annual cartridge replacement | $396 for standard setup with fluoride removal. | $89 (with fluoride removal) ($66 without fluoride removal). Varies according to cartridges chosen from many available. |
| Cartridge availability | Must buy from manufacturer or reseller of manufacturer’s product. | Readily available from Pure Water Products or almost anyone who sells a water filter. Uses any standard 2.5″ X 10″ cartridges. Any cartridge on this page will fit the unit. |
| Parts availability | Filter housing caps and o rings might be hard to find. | All parts are standard size and readily available from Pure Water Products or many other water treatment suppliers. The sump o rings, for example, are a widely available part–easy to find, easy to replace. |